OPEN-SOURCE SCRIPT
CMYK RYTHM
◊ Introduction
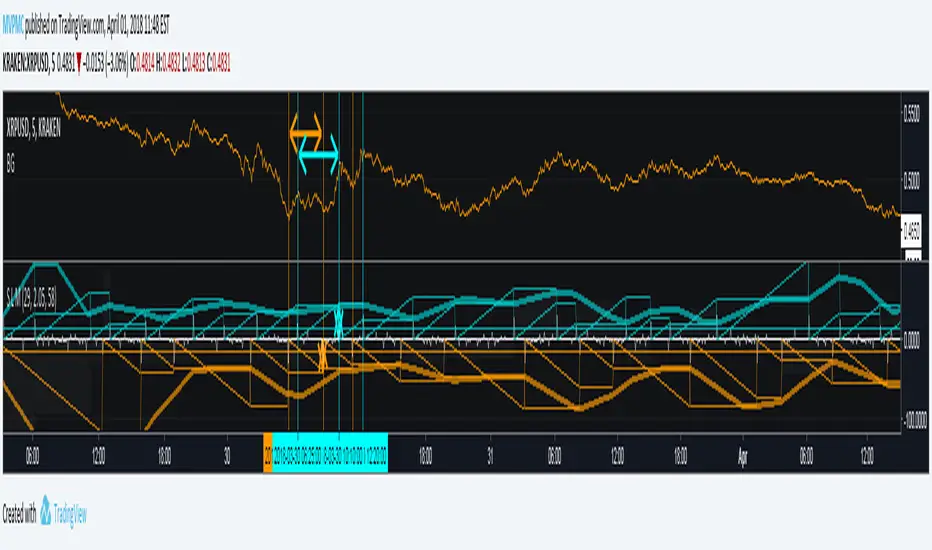
This script makes use of a sliding matrix, to search the highest/lowest point in the slider, it then counts the amount of times it was high/low, giving the distance from a previous high/low.
Every High/low are granted values, being a lower value for shorted periods, and a larger value for Longer periods.
This reveals the different period lengths of active frequencies.
Doing this with different slider lenghts would result in measuring with different mean period lenghts.
◊ Origin
From my dream last night.
This is a part of Project XIAM.
◊ Theoretical Approach
Philosophy β :: Rythmic
Searching for the period lenght of several frequencys at once.
◊ Usage
This is an alalythical tool, to be used for Automatically adjusting settings on Indicators that presume a period length for calculation.
Calculations are based on Past values, and no reversal measures or fail-safes are applied, so it will only be useful during a continuation of trend.
◊ Features
Matrix Calculation of Lowest/Highest points in a sliding series with Steady Length.
In the future Several slider lenghts will be applied to search for Frequencies of different magnitudes.
Lenght between TOPS, DIPS , and an SMA that smoothens this.
BIAS Is TOP to DIP Minus DIP to TOP, to uncover Bullish/Bearish index of market movements.
◊ Community
CMYK :: discord.gg/bg2TDvh
AUTOVIEW :: discordapp.com/invite/BFz8VPn
TRADINGVIEW UNOFFICIAL :: discord.gg/fZFcJBy
Açık kaynak kodlu komut dosyası
Gerçek TradingView ruhuyla, bu komut dosyasının mimarı, yatırımcıların işlevselliğini inceleyip doğrulayabilmesi için onu açık kaynaklı hale getirdi. Yazarı tebrik ederiz! Ücretsiz olarak kullanabilseniz de, kodu yeniden yayınlamanın Topluluk Kurallarımıza tabi olduğunu unutmayın.
MVPMC
Feragatname
Bilgiler ve yayınlar, TradingView tarafından sağlanan veya onaylanan finansal, yatırım, alım satım veya diğer türden tavsiye veya öneriler anlamına gelmez ve teşkil etmez. Kullanım Koşulları bölümünde daha fazlasını okuyun.