OPEN-SOURCE SCRIPT
Güncellendi Bionic -- Expected Weekly Levels (Public)
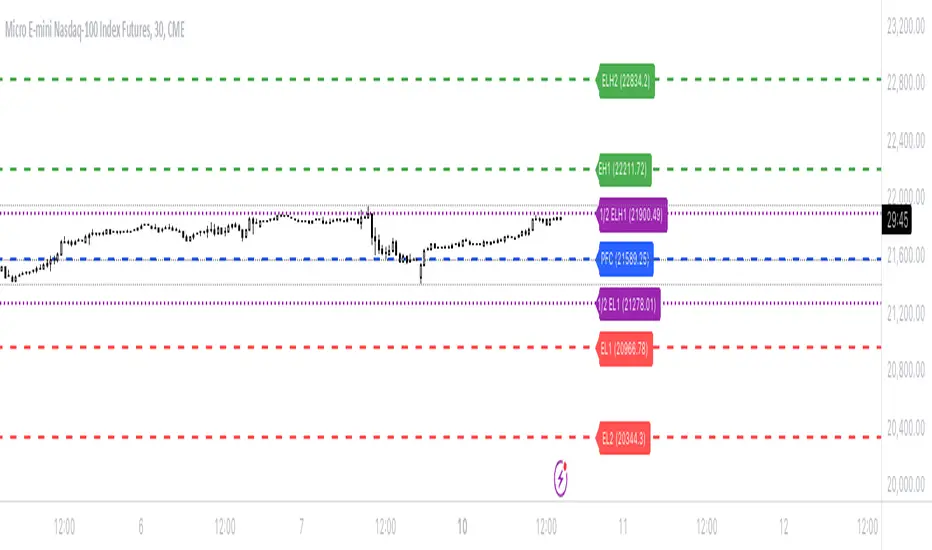
This script will draw lines for Expected Weekly Levels based upon Previous Friday Close, Implied Volatility (EOD Friday), and the square root of Days to Expire (always 7) / 365.
Script will draw 2 high and low levels:
*1st levels are 1 standard deviation from the Previous Friday Close.
* 2nd levels are 2 standard deviation from the Previous Friday Close.
There are also a 1/2 Low and 1/2 Low 1st level. These are 1/2 a standard deviation and act more as a point of interest level. 1/2 levels have 34% probability.
Configurations:
* All lines styles are individually configurable
* All lines can individually be turned on/off
* Text for all lines can be changed
* Global config allows for the
* Lines to show the price on the label
* Lines to have text in the label
* Hide or show all labels
* Lines offset from price is configurable
* Label size is configurable
Sürüm Notları
* Added individual Implied Volatility inputs for Calls/Longs and Puts/Short* IV may be different between Calls and Puts based upon overall market sentiment
* Allows greater precision and flexibility for the end user
* The same values can be used in both input if desired.
Sürüm Notları
Updated calculation from 365 days to 252 days. Industry standard when calculated values is 252 (the number of trading days in a year) and NOT 365 (number of calendar days in a year).
Also updated the default input for the Previous Friday close to be 0.0.
Sürüm Notları
* Made days available for trading configurable. Deafult is 365 days (total days in calendar year) and other options commonly used is 252 days (number of trading days in a calendar year).
++++ User now has ability to choose number of days for calcualtion.
+ Changed default line from Dashed to Solid
Sürüm Notları
Updated script to include 3 standard deviations, i.e. a 3rd Level low & high. Sürüm Notları
Fixed bug with 3rd level deviation calculationAçık kaynak kodlu komut dosyası
Gerçek TradingView ruhuyla, bu komut dosyasının mimarı, yatırımcıların işlevselliğini inceleyip doğrulayabilmesi için onu açık kaynaklı hale getirdi. Yazarı tebrik ederiz! Ücretsiz olarak kullanabilseniz de, kodu yeniden yayınlamanın Topluluk Kurallarımıza tabi olduğunu unutmayın.
Feragatname
Bilgiler ve yayınlar, TradingView tarafından sağlanan veya onaylanan finansal, yatırım, alım satım veya diğer türden tavsiye veya öneriler anlamına gelmez ve teşkil etmez. Kullanım Koşulları bölümünde daha fazlasını okuyun.
Açık kaynak kodlu komut dosyası
Gerçek TradingView ruhuyla, bu komut dosyasının mimarı, yatırımcıların işlevselliğini inceleyip doğrulayabilmesi için onu açık kaynaklı hale getirdi. Yazarı tebrik ederiz! Ücretsiz olarak kullanabilseniz de, kodu yeniden yayınlamanın Topluluk Kurallarımıza tabi olduğunu unutmayın.
Feragatname
Bilgiler ve yayınlar, TradingView tarafından sağlanan veya onaylanan finansal, yatırım, alım satım veya diğer türden tavsiye veya öneriler anlamına gelmez ve teşkil etmez. Kullanım Koşulları bölümünde daha fazlasını okuyun.