vdubus

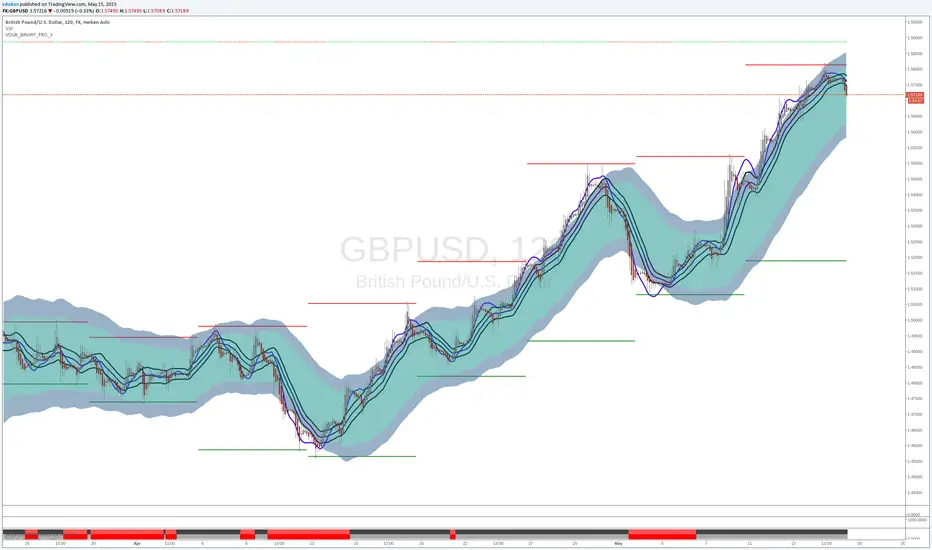
VDUB_BINARY_PRO_3

NEW UPDATED BINARY PRO 3_V2 HERE -

VDUB_BINARY_PRO_3_V1 UPGRADE from binary PRO 1 / testing/ / experimental / Trade the curves / Highs -Lows / Band cross over/ Testing using heikin ashi
//Linear Regression Curve
//Centre band
//CM_Gann Swing HighLow V2/Modified////// MA input NOT WORKING ! - I broke it :s
//Vdub_Tetris_V2/ Modified

*Update Tip /Optional
Set the centre band to '34 to run centre line

Açık kaynak kodlu komut dosyası

Gerçek TradingView ruhuyla, bu betiğin yazarı, yatırımcının anlayabilmesi ve doğrulayabilmesi için onu açık kaynak olarak yayınladı. Yazarın eline sağlık! Bunu ücretsiz olarak kullanabilirsiniz, ancak bu kodun bir yayında yeniden kullanımı Kullanım Koşulları ile yönetilir. Bir grafikte kullanmak için favorilere ekleyebilirsiniz.

Feragatname

Bilgiler ve yayınlar, TradingView tarafından sağlanan veya onaylanan finansal, yatırım, işlem veya diğer türden tavsiye veya tavsiyeler anlamına gelmez ve teşkil etmez. Kullanım Şartları'nda daha fazlasını okuyun.

Bu komut dosyasını bir grafikte kullanmak ister misiniz?
study(title="VDUB_BINARY_PRO_3", shorttitle="VDUB_BINARY_PRO_3", overlay=true)
source = close
length = input(56, minval=1, title = "WMA Length")
atrlen = input(100, minval=1, title = "ATR Length")
mult1 = 2
mult2 = 3
ma = wma(source, length)
range =  tr
rangema = wma(range, atrlen)

up1 = ma + rangema * mult1
up2 = ma + rangema * mult2

dn1 = ma - rangema * mult1
dn2 = ma - rangema * mult2

color1 = white
color2 = white

u4 = plot(up1, color = color1)
u8 = plot(up2, color = color2)

d4 = plot(dn1, color = color1)
d8 = plot(dn2, color = color2)

fill(u8, u4, color=#30628E, transp=50)
fill(d8, d4, color=#30628E, transp=50)
fill(d4, u4, color=#128E89, transp=50)

//Linear regression band
src = close
//Input
nlookback = input (defval = 20, minval = 1, title = "Number of Lookback")
scale = input(defval=1,  title="scale of ATR")
nATR = input(defval = 14, title="ATR Parameter")

//Linear Regression Curve
lrc = linreg(src, nlookback, 0)
lrc_u = lrc + scale*atr(nATR)
lrc_l = lrc - scale*atr(nATR)
plot(lrc, color = blue, style = line, linewidth = 3)
//------------------------------------
//Center band
periods=input(13, minval=1, title="MA Period")
pc = input(true, title="MA BAND")

hld = iff(close > sma(high,periods)[1], 1, iff(close<sma(low,periods)[1],-1, 0))
hlv = valuewhen(hld != 0, hld, 1)

hi = pc and hlv == -1 ? sma(high, periods) : na
lo = pc and hlv == 1 ? sma(low,periods) : na
plot(avg(sma(high,periods)+2.5*(sma(high,periods)-sma(low,periods)),sma(low,periods)-2.5*(sma(high,periods)-sma(low,periods))), color=navy, style=line,linewidth=3)
plot(pc and sma(high, periods) ? sma(high, periods):na ,title="Swing High Plot", color=black,style=line, linewidth=3)
plot(pc and sma(low,periods) ? sma(low,periods) : na ,title="Swing Low Plot", color=black,style=line, linewidth=3)

//---------------------------------------------------------------------------------------------
//CM_Gann Swing HighLow V2/Modified//////   MA input NOT WORKING !!!!   ?
periods2=input(9, minval=1, title="Moving Average Period")
pttb = input(true, title="Trend Indicator")
//shb = input(false)
sbh = input(false, title="Background MA crossover bars")
//code for Calculations
hld2 = iff(close > sma(high,periods)[1], 1, iff(close<sma(low,periods)[1],-1, 0))
hlv2 = valuewhen(hld2 != 0, hld2, 1)
//code for Plot Statements
hi2 = hlv2 == -1 ? sma(high, periods) : na
lo2 = hlv2 == 1 ? sma(low,periods) : na

//Rules for coloring Background highlights & Highlight Bars
//closeAbove() => shb and close > hi2 and close[1] < hi2
BHcloseAbove = sbh and close > hi2 and close[1] < hi2
//closeBelow() => shb and close < lo2 and close[1] > lo2
BHcloseBelow = sbh and close < lo2 and close[1] > lo2

bgcolor(BHcloseAbove ? green : na, transp=60)
bgcolor(BHcloseBelow ? red : na, transp=60)

plotshape(pttb and hi2 ? hi2: na,title="Gann Swing High Plots-Triangles Down Top of Screen", offset=0, style=shape.triangledown, location=location.top, color=red, transp=0)
plotshape(pttb and lo2 ? lo2 : na, title="Gann Swing Low Plots-Triangles Up Bottom of Screen",offset=0, style=shape.triangleup, location=location.top, color=lime, transp=0)
//=======================================================
//study("Vdub_Tetris_V2", overlay=true)
Sml_Channel_TF_mins_D_W_M = input("W")
Range2 = input(1)

SELL = security(tickerid, Sml_Channel_TF_mins_D_W_M, highest(Range2))
BUY = security(tickerid, Sml_Channel_TF_mins_D_W_M, lowest(Range2))

HI = plot(SELL, color=SELL!=SELL[1]?na:red,linewidth=2 )
LO = plot(BUY, color=BUY!=BUY[1]?na:green,linewidth=2 )
fill(HI, LO, color=#E3CAF1, transp=100)
Hcon = high >= SELL
Lcon = low <= BUY

plotshape(Hcon, style=shape.triangledown, color=maroon, location=location.abovebar)
plotshape(Lcon, style=shape.triangleup, color=green, location=location.belowbar)
range2 = SELL-BUY
//--------------------------------------------------

//=====================================================================//