OPEN-SOURCE SCRIPT
Triple Bollinger Bands
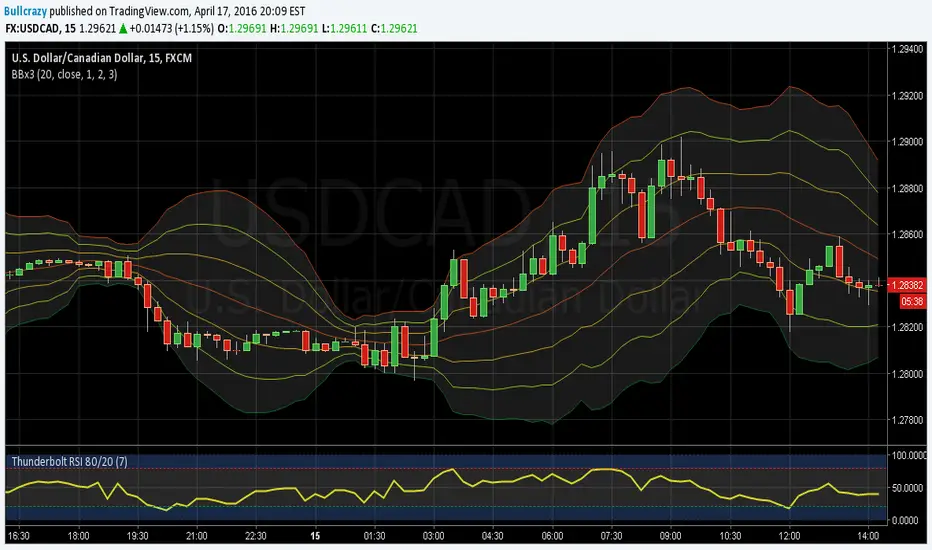
I found myself using multiple bollinger bands a lot so I decided to add them all to one script and add the ability to adjust them by 0.2. It has helped me by not taking up as much space in the upper left corner as well as improving my in's and outs of trend continuation trades. If you manage to find a double top at +2 or greater deviation, and with a bearish divergence on the RSI as shown in this picture, GO SHORT SON! This was a fast and easy 35 - 40 pips and if you used your fibonacci for an exit you had little doubt of the final result and could have even been prepared for an immediate reversal knowing you were then at an oversold -2.8 deviation. I could go on and on........
Açık kaynak kodlu komut dosyası
Gerçek TradingView ruhuna uygun olarak, bu komut dosyasının oluşturucusu bunu açık kaynaklı hale getirmiştir, böylece yatırımcılar betiğin işlevselliğini inceleyip doğrulayabilir. Yazara saygı! Ücretsiz olarak kullanabilirsiniz, ancak kodu yeniden yayınlamanın Site Kurallarımıza tabi olduğunu unutmayın.
Feragatname
Bilgiler ve yayınlar, TradingView tarafından sağlanan veya onaylanan finansal, yatırım, işlem veya diğer türden tavsiye veya tavsiyeler anlamına gelmez ve teşkil etmez. Kullanım Şartları'nda daha fazlasını okuyun.