QuantPivote
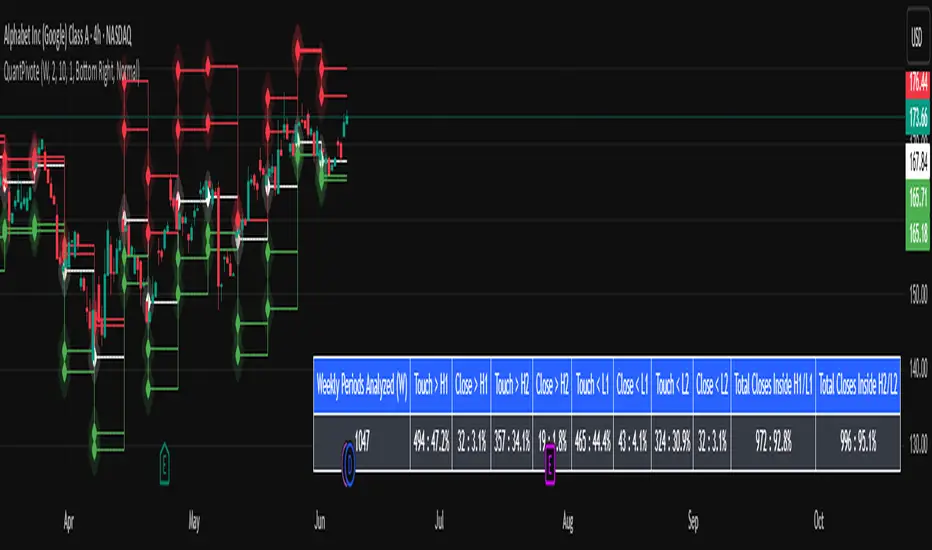
Weekly Periods Analyzed :
- The number of total periods loaded and analyzed is on the chart.
Touch > H1 :
- Pivot level average price exceeded or was equal to, but did not close above.
Close > H1 :
- How often has the price closed above the H1 pivot level.
Touch > H2 :
- Pivot level one standard deviation above H1.
- The price exceeded or was equal to, but did not close above.
Close > H2 :
- How many times has the price closed above the H2 pivot level .
Touch > L1 :
- Pivot level average price exceeded or was equal to, but did not close below.
Close > L1 :
- How many times has the price closed below the L1 pivot level.
Touch > L2 :
- Pivot level one standard deviation below L1.
- The price exceeded or was equal to, but did not closed below.
Close > L2 :
- How many times has the price closed below the L2 pivot level.
Total Closes Inside H1 / L1 :
- Total number of times with in the periods analyzed that there were closes within H1 / L1 .
Total Closes Inside H2 / L2 :
- Total number of times with in the periods analyzed that there were closes within H2 / L2 respectively.
Pivots :
Pivot lines are a function of the analysis and averaging period inputs.
- H1 represents the average point which the highest price is achieved for the selected time period (analysis period).
- L1 represents the average point which the lowest price is achieved for the selected time period (analysis period).
- H2/L2 = One standard deviation away from the inner high H1 or low L1 bands.
Yalnızca davetli komut dosyası
Bu komut dosyasına yalnızca yazar tarafından onaylanan kullanıcılar erişebilir. Kullanmak için izin istemeniz ve almanız gerekir. Bu genellikle ödeme yapıldıktan sonra verilir. Daha fazla ayrıntı için aşağıdaki yazarın talimatlarını izleyin veya doğrudan pineaflAlgo ile iletişime geçin.
TradingView, yazarına tamamen güvenmediğiniz ve nasıl çalıştığını anlamadığınız sürece bir komut dosyası için ödeme yapmanızı veya kullanmanızı TAVSİYE ETMEZ. Ayrıca topluluk komut dosyalarımızda ücretsiz, açık kaynaklı alternatifler bulabilirsiniz.
Yazarın talimatları
Feragatname
Yalnızca davetli komut dosyası
Bu komut dosyasına yalnızca yazar tarafından onaylanan kullanıcılar erişebilir. Kullanmak için izin istemeniz ve almanız gerekir. Bu genellikle ödeme yapıldıktan sonra verilir. Daha fazla ayrıntı için aşağıdaki yazarın talimatlarını izleyin veya doğrudan pineaflAlgo ile iletişime geçin.
TradingView, yazarına tamamen güvenmediğiniz ve nasıl çalıştığını anlamadığınız sürece bir komut dosyası için ödeme yapmanızı veya kullanmanızı TAVSİYE ETMEZ. Ayrıca topluluk komut dosyalarımızda ücretsiz, açık kaynaklı alternatifler bulabilirsiniz.