OPEN-SOURCE SCRIPT
Stocks Box (by ChartArt)
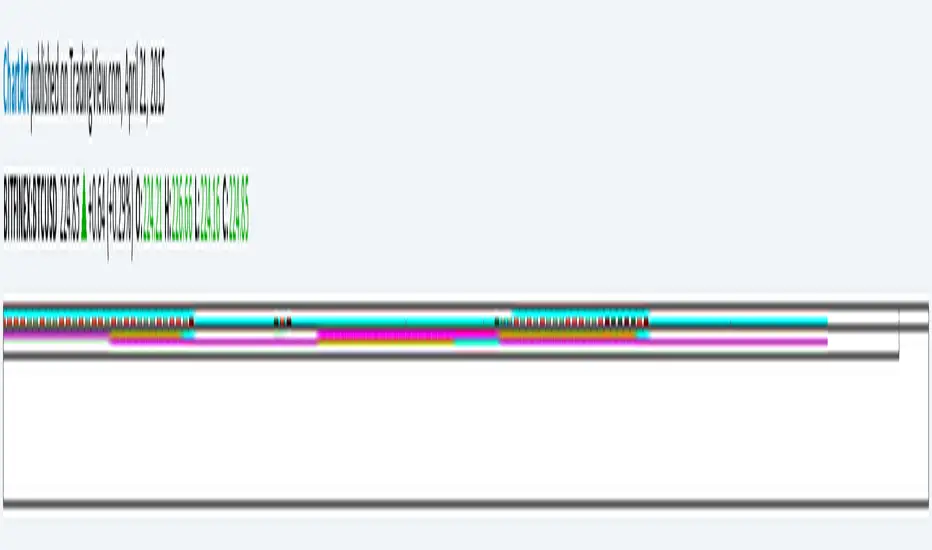
Get a multi-time frame (MTF) view of the price!
You can select to see either close price (default), or HL2 price, or HLC3 price, or OHLC4 price of all time-frames.And you change the smoothing method (and smoothing period) of the daily price, which is shown as a blue line, with period 10 WMA smoothing as default.

P:S. I had the drawings on the chart hidden, because they have nothing to do with the indicator, but with publishing the script they showed up again :(
You can select to see either close price (default), or HL2 price, or HLC3 price, or OHLC4 price of all time-frames.And you change the smoothing method (and smoothing period) of the daily price, which is shown as a blue line, with period 10 WMA smoothing as default.
P:S. I had the drawings on the chart hidden, because they have nothing to do with the indicator, but with publishing the script they showed up again :(
Açık kaynak kodlu komut dosyası
Gerçek TradingView ruhuna uygun olarak, bu komut dosyasının oluşturucusu bunu açık kaynaklı hale getirmiştir, böylece yatırımcılar betiğin işlevselliğini inceleyip doğrulayabilir. Yazara saygı! Ücretsiz olarak kullanabilirsiniz, ancak kodu yeniden yayınlamanın Site Kurallarımıza tabi olduğunu unutmayın.
Feragatname
Bilgiler ve yayınlar, TradingView tarafından sağlanan veya onaylanan finansal, yatırım, işlem veya diğer türden tavsiye veya tavsiyeler anlamına gelmez ve teşkil etmez. Kullanım Şartları'nda daha fazlasını okuyun.