PROTECTED SOURCE SCRIPT
Güncellendi Southnjes - RSI Zones.
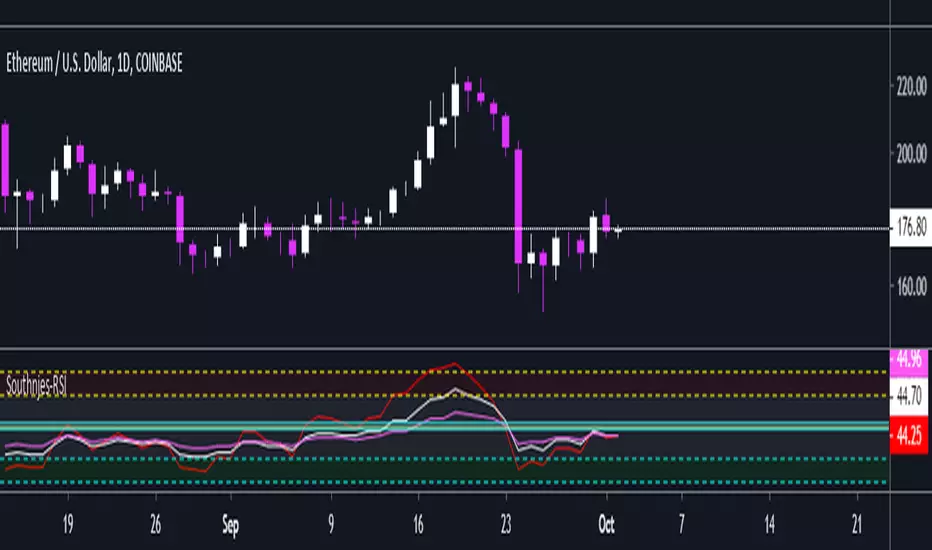
Here is a simple RSI indicator that has changeable values. It has centerline at 50% along with areas of interest for conservative overbought/oversold along with aggressive overbought/oversold areas. The 70/30 and 85/15 values are built in but you can change them to whatever you want. The upper and lower interest areas are banded with color for ease of viewing.
After watching ChingasX RSI video from Tradingroomap where Chingas added custom lines. I thought I'd give back a little and upload my script that I have been using.
Hope someone finds it useful. :)
After watching ChingasX RSI video from Tradingroomap where Chingas added custom lines. I thought I'd give back a little and upload my script that I have been using.
Hope someone finds it useful. :)
Sürüm Notları
Added the second value RSI level (per Chingas X request). He gives so much back to the community. :)Sürüm Notları
Added a third RSI input level for a longer, smoother period. You now have:7: Shorter-term trading (Noiser/more oscillation).
14: Standard.
25: Longer-term trading (Smoother, less oscillation).
Don't forget the importance of the centerline either.
Per dailyFX:
"Technical forex traders use the centerline to show shifts in the trend. If RSI is above 50, momentum is considered up and traders can look for opportunities to buy the market. A drop below 50 would indicate the development of a new bearish market trend".
:)
Sürüm Notları
Added a third RSI input level for a longer, smoother period. You now have:7: Shorter-term trading (Noiser/more oscillation).
14: Standard.
25: Longer-term trading (Smoother, less oscillation).
Don't forget the importance of the centerline either.
Per dailyFX:
"Technical forex traders use the centerline to show shifts in the trend. If RSI is above 50, momentum is considered up and traders can look for opportunities to buy the market. A drop below 50 would indicate the development of a new bearish market trend".
:)
Korumalı komut dosyası
Bu komut dosyası kapalı kaynak olarak yayınlanmaktadır. Ancak, özgürce ve herhangi bir sınırlama olmaksızın kullanabilirsiniz – daha fazla bilgi burada.
Feragatname
Bilgiler ve yayınlar, TradingView tarafından sağlanan veya onaylanan finansal, yatırım, işlem veya diğer türden tavsiye veya tavsiyeler anlamına gelmez ve teşkil etmez. Kullanım Şartları'nda daha fazlasını okuyun.