OPEN-SOURCE SCRIPT
NSDT Auto Fib Support / Resistance Levels
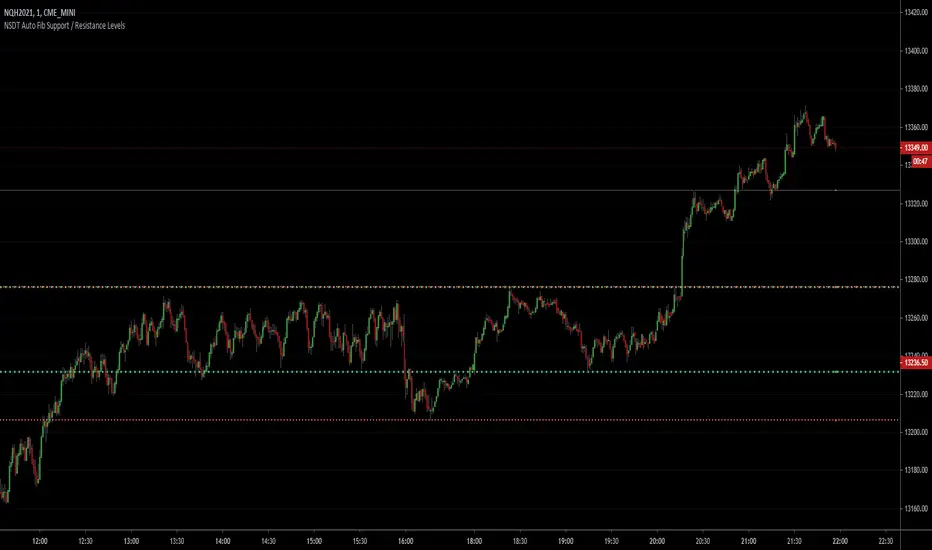
This script automatically plots support and resistance lines using the fib numbers as the amount of candles to lookback. Each line is colored differently to easily identify the support/resistance pair (i.e. 23%, 38%, 61%, etc..) with the 50% (Green) and 78% (Red) a thicker line. All variables are editable. Added alert capability.
Açık kaynak kodlu komut dosyası
Gerçek TradingView ruhuyla, bu komut dosyasının mimarı, yatırımcıların işlevselliğini inceleyip doğrulayabilmesi için onu açık kaynaklı hale getirdi. Yazarı tebrik ederiz! Ücretsiz olarak kullanabilseniz de, kodu yeniden yayınlamanın Topluluk Kurallarımıza tabi olduğunu unutmayın.
ALL indicators, strategies and bots are included with Discord access.
NorthStarDayTrading.com/discord
youtube.com/shorts/fWFQE7uEHvU
NorthStarDayTrading.com/discord
youtube.com/shorts/fWFQE7uEHvU
Feragatname
Bilgiler ve yayınlar, TradingView tarafından sağlanan veya onaylanan finansal, yatırım, alım satım veya diğer türden tavsiye veya öneriler anlamına gelmez ve teşkil etmez. Kullanım Koşulları bölümünde daha fazlasını okuyun.