OPEN-SOURCE SCRIPT
Heiken Ashi Ichimoku
WELCOME!
I want to share with you with my Heiken Ashi Ichimoku system
.
Remember to fallow me to get more startegy, or signals. Click like if u enjoy it :)
IMPORTANT:
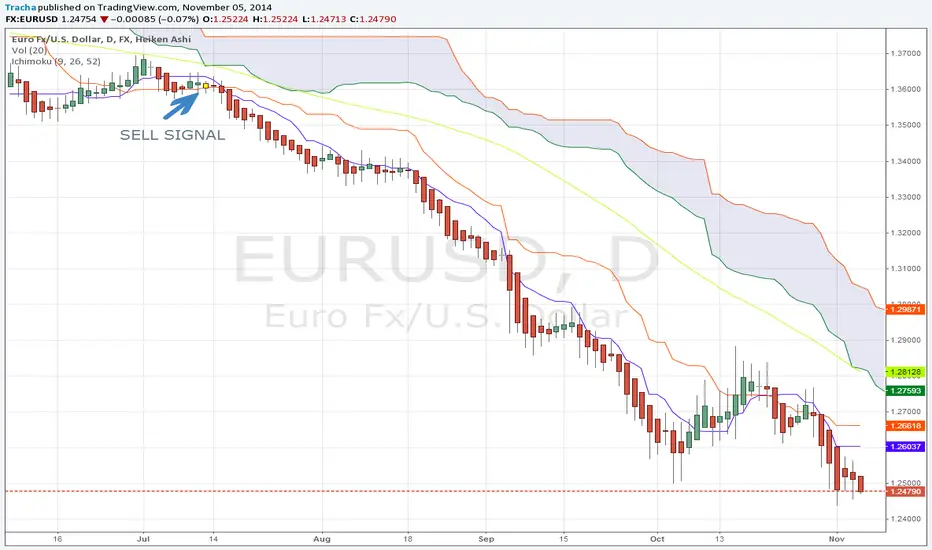
System works with Heiken Ashi bars!!
The signals.
SELL SIGNAL:
1. When price is below:
a) cloud
b) blue line
2. When last bar was green, and now turn to red
3. When heiken ashi bar is close to SMA55, but its below SMA55
BUY SIGNAL:
1. When price is above:
a) cloud
b) blue line
2. When last bar was red, and now turn to green
3. When heiken ashi bar is close to SMA55, but its above SMA55
I want to share with you with my Heiken Ashi Ichimoku system
.
Remember to fallow me to get more startegy, or signals. Click like if u enjoy it :)
IMPORTANT:
System works with Heiken Ashi bars!!
The signals.
SELL SIGNAL:
1. When price is below:
a) cloud
b) blue line
2. When last bar was green, and now turn to red
3. When heiken ashi bar is close to SMA55, but its below SMA55
BUY SIGNAL:
1. When price is above:
a) cloud
b) blue line
2. When last bar was red, and now turn to green
3. When heiken ashi bar is close to SMA55, but its above SMA55
Açık kaynak kodlu komut dosyası
Gerçek TradingView ruhuna uygun olarak, bu komut dosyasının oluşturucusu bunu açık kaynaklı hale getirmiştir, böylece yatırımcılar betiğin işlevselliğini inceleyip doğrulayabilir. Yazara saygı! Ücretsiz olarak kullanabilirsiniz, ancak kodu yeniden yayınlamanın Site Kurallarımıza tabi olduğunu unutmayın.
Feragatname
Bilgiler ve yayınlar, TradingView tarafından sağlanan veya onaylanan finansal, yatırım, işlem veya diğer türden tavsiye veya tavsiyeler anlamına gelmez ve teşkil etmez. Kullanım Şartları'nda daha fazlasını okuyun.