PROTECTED SOURCE SCRIPT
FXTDPR Dual Timeframe High-Low Boxes
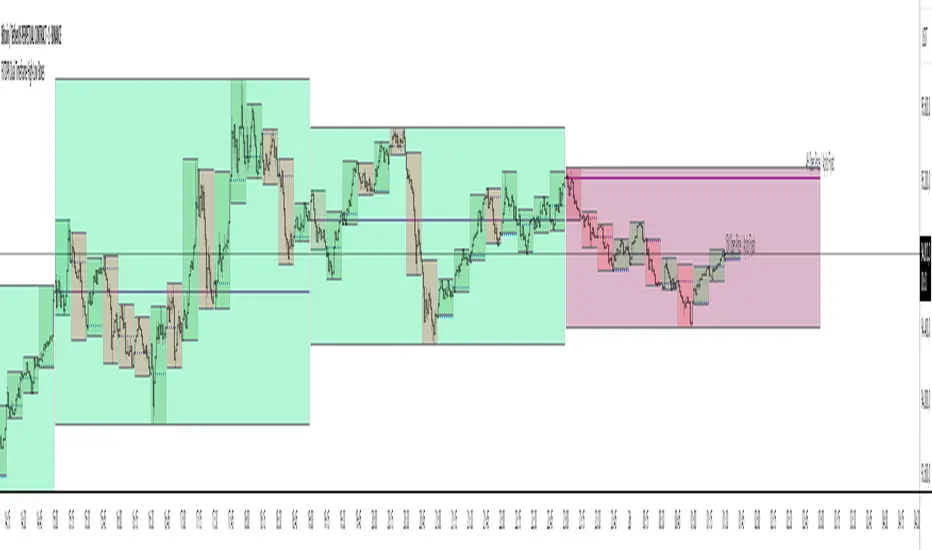
The "Dual Timeframe High-Low Boxes" indicator is designed to visualize price ranges and key levels across two user-defined timeframes (default: 15-minute and 4-hour) on the same chart. It draws rectangular boxes representing the high and low price levels within each timeframe, along with a horizontal line indicating the opening price of the timeframe. Labels are added to mark the opening price with bilingual text (English/Turkish). The indicator is highly customizable, allowing users to adjust timeframes, colors, transparency, line styles, and display options.
// Key Features:
// 1. **Dual Timeframe Support**: Simultaneously displays boxes for two timeframes (e.g., 15M and 4H), enabling analysis of both short-term and long-term price movements.
// 2. **High-Low Boxes**: Each box represents the highest and lowest prices within the selected timeframe, dynamically updating as new highs or lows occur.
// 3. **Opening Price Line**: A horizontal line is drawn at the opening price of each timeframe, fixed from the start to the end of the timeframe period.
// 4. **Bilingual Labels**: Labels display the timeframe and opening price in both English and Turkish (e.g., "15M Open Price / Açılış Fiyatı") for enhanced accessibility.
// 5. **Customizable Display**: Users can choose to display boxes for both timeframes, only Timeframe 1, or only Timeframe 2 via the "Display Timeframes" setting.
// 6. **Color and Style Customization**: Separate settings for bullish/bearish box colors, opening price line color, line style (solid, dashed, dotted), and label text color for each timeframe.
// 7. **Transparency Control**: Adjustable transparency for boxes to prevent chart clutter.
// 8. **Performance Optimization**: Limits the number of displayed boxes to 500 (via max_boxes_count) to ensure smooth performance.
// 9. **Accurate Timing**: Boxes start precisely at the beginning of each timeframe’s candle (e.g., 16:45 for 15M, 00:00 for 4H), ensuring alignment with the selected timeframe.
// 10. **No Input Confirmation**: The indicator starts with default settings (15M and 4H, both displayed) without requiring user confirmation, streamlining the setup process.
// How It Works:
// - The indicator uses request.security() to fetch time data for the user-defined timeframes and detects new timeframe periods using ta.change().
// - For each timeframe, it initializes a box at the start of the period, setting the initial high, low, and open prices.
// - As new candles form within the timeframe, the box’s high and low boundaries are updated to reflect the highest and lowest prices.
// - The box color changes based on whether the closing price is above (bullish) or below (bearish) the opening price.
// - A fixed horizontal line is drawn at the opening price, spanning the timeframe’s duration, with a label at the end of the box indicating the timeframe and opening price.
// - Users can toggle between displaying both timeframes or a single timeframe, with all settings (colors, styles, transparency) applied independently for each timeframe.
// Usage:
// - Add the indicator to your chart, and it will automatically display 15M and 4H boxes with default settings.
// - Use the settings menu to customize timeframes, colors, line styles, transparency, or to select which timeframes to display.
// - Ideal for identifying support/resistance levels, breakout opportunities, or trend analysis across multiple timeframes.
// Notes:
// - For optimal performance, use a chart timeframe equal to or lower than the smaller selected timeframe (e.g., 15M chart for 15M and 4H boxes).
// - The indicator is designed for flexibility, supporting timeframes from 1 minute to monthly periods.
// - To avoid chart clutter, adjust transparency settings or reduce max_boxes_count for long historical data.
Korumalı komut dosyası
Bu komut dosyası kapalı kaynak olarak yayınlanmaktadır. Ancak, ücretsiz ve herhangi bir sınırlama olmaksızın kullanabilirsiniz – daha fazla bilgiyi buradan edinebilirsiniz.
Telegram Kanalım için Bağlantı Linki
t.me/+jzPIy7zWo
okx.com/join/FXTDPR
t.me/+jzPIy7zWo
okx.com/join/FXTDPR
Feragatname
Bilgiler ve yayınlar, TradingView tarafından sağlanan veya onaylanan finansal, yatırım, alım satım veya diğer türden tavsiye veya öneriler anlamına gelmez ve teşkil etmez. Kullanım Koşulları bölümünde daha fazlasını okuyun.