PROTECTED SOURCE SCRIPT
Pivot Meter

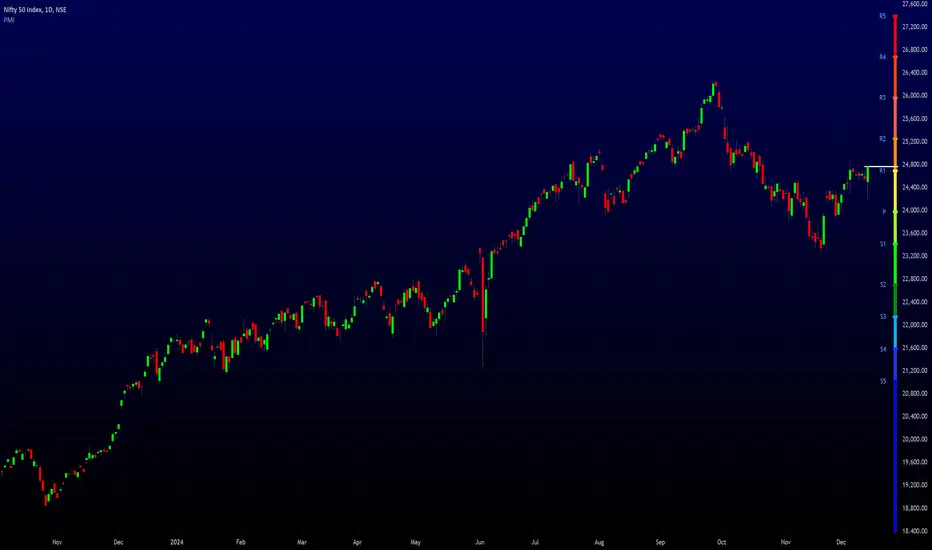
The "Pivot Meter" is a indicator designed to plot pivot levels (support and resistance) directly on the chart. It offers two types of pivot calculations STANDARD and FIBONACCI, allowing traders to choose their preferred method. Here's an overview of its features and functionalities:
________________________________________
Key Features
1. Pivot Types:
o STANDARD: Traditional calculation based on the previous period's high, low, and close.
o FIBONACCI: Uses Fibonacci ratios to calculate support and resistance levels.
2. Dynamic Time Frame Adjustment:
o The indicator adjusts its calculations based on the chart's timeframe, aligning pivot calculations with appropriate periods.
3. Pivot Levels:
o Resistance Levels (R1 to R5): Five resistance levels calculated based on the selected pivot type.
o Support Levels (S1 to S5): Five support levels corresponding to the pivot type.
o Central Pivot (P): The base pivot level for reference.
4. Visualization:
o All pivot levels are plotted as coloured horizontal bands on the chart for easy identification.
o Colours range from warm tones (red for higher resistance levels) to cool tones (blue for lower support levels).
o Thickness and styling make these levels visually prominent.
5. Real-Time Price Line:
o A dynamically updating line marks the current price, with customizable colour and width for visibility.
6. Labels for Levels:
o Labels are placed next to each pivot level for identification (e.g., R1, S1, Pivot).
o Labels dynamically adjust their position with the chart’s bar progression.
________________________________________
Purpose
This indicator helps traders identify potential reversal points, support and resistance levels, and critical price zones. It is especially useful for:
• Day Traders: Quickly assess key levels for short-term trades.
• Swing Traders: Spot significant support/resistance zones over longer periods.
• Trend Followers: Use pivot levels to confirm breakouts or bounces.
________________________________________
Customization Options
• Pivot Type Selection: Choose between STANDARD and FIBONACCI.
• Price Line Colour: Customize the colour of the current price line for better integration with your chart setup.
________________________________________
Technical Details
• Security Function: Data from higher timeframes is accessed using request.security, ensuring accurate and multi-timeframe pivot calculations.
• Dynamic Labelling: Labels update their positions with every new bar to remain synchronized with the latest data.
________________________________________
Usage
Traders can add this indicator to their TradingView charts to monitor critical levels and strategize entries, exits, and stop-loss placements based on the proximity to these pivots. The dual pivot calculation methods make it versatile for diverse trading styles.
________________________________________
Key Features
1. Pivot Types:
o STANDARD: Traditional calculation based on the previous period's high, low, and close.
o FIBONACCI: Uses Fibonacci ratios to calculate support and resistance levels.
2. Dynamic Time Frame Adjustment:
o The indicator adjusts its calculations based on the chart's timeframe, aligning pivot calculations with appropriate periods.
3. Pivot Levels:
o Resistance Levels (R1 to R5): Five resistance levels calculated based on the selected pivot type.
o Support Levels (S1 to S5): Five support levels corresponding to the pivot type.
o Central Pivot (P): The base pivot level for reference.
4. Visualization:
o All pivot levels are plotted as coloured horizontal bands on the chart for easy identification.
o Colours range from warm tones (red for higher resistance levels) to cool tones (blue for lower support levels).
o Thickness and styling make these levels visually prominent.
5. Real-Time Price Line:
o A dynamically updating line marks the current price, with customizable colour and width for visibility.
6. Labels for Levels:
o Labels are placed next to each pivot level for identification (e.g., R1, S1, Pivot).
o Labels dynamically adjust their position with the chart’s bar progression.
________________________________________
Purpose
This indicator helps traders identify potential reversal points, support and resistance levels, and critical price zones. It is especially useful for:
• Day Traders: Quickly assess key levels for short-term trades.
• Swing Traders: Spot significant support/resistance zones over longer periods.
• Trend Followers: Use pivot levels to confirm breakouts or bounces.
________________________________________
Customization Options
• Pivot Type Selection: Choose between STANDARD and FIBONACCI.
• Price Line Colour: Customize the colour of the current price line for better integration with your chart setup.
________________________________________
Technical Details
• Security Function: Data from higher timeframes is accessed using request.security, ensuring accurate and multi-timeframe pivot calculations.
• Dynamic Labelling: Labels update their positions with every new bar to remain synchronized with the latest data.
________________________________________
Usage
Traders can add this indicator to their TradingView charts to monitor critical levels and strategize entries, exits, and stop-loss placements based on the proximity to these pivots. The dual pivot calculation methods make it versatile for diverse trading styles.
Korumalı komut dosyası
Bu komut dosyası kapalı kaynak olarak yayınlanmaktadır. Ancak, ücretsiz ve herhangi bir sınırlama olmaksızın kullanabilirsiniz – daha fazla bilgiyi buradan edinebilirsiniz.
Feragatname
Bilgiler ve yayınlar, TradingView tarafından sağlanan veya onaylanan finansal, yatırım, alım satım veya diğer türden tavsiye veya öneriler anlamına gelmez ve teşkil etmez. Kullanım Koşulları bölümünde daha fazlasını okuyun.