OPEN-SOURCE SCRIPT
Güncellendi Jigga - Survival Level
Hi All !!
Its always the case that we buy a stock and it starts falling !! What a new investor will do is to add few more on downfall and then few more until they stuck all their case to same falling stock.
I thought to create a level which can help long term investor on when to buy and sell.
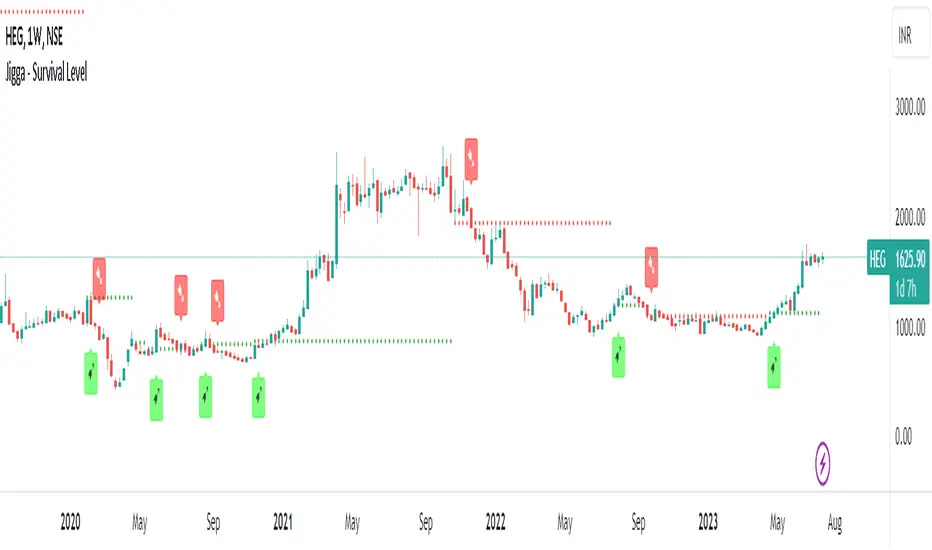
Logic:
I have used multiple indicators logic all into one and find out when majority of them are showing positive sign.
Green /Red line will be shown when majority are in positive / negative territory.
Buy and sell signal will be generated based on this line only.
Note:
Use this on Weekly chart on good fundamental stock for long term investment.
Its always the case that we buy a stock and it starts falling !! What a new investor will do is to add few more on downfall and then few more until they stuck all their case to same falling stock.
I thought to create a level which can help long term investor on when to buy and sell.
Logic:
I have used multiple indicators logic all into one and find out when majority of them are showing positive sign.
Green /Red line will be shown when majority are in positive / negative territory.
Buy and sell signal will be generated based on this line only.
Note:
Use this on Weekly chart on good fundamental stock for long term investment.
Sürüm Notları
Updated script for early exit sign and protect downside. This may increase number of trades for range bound stocks.Sürüm Notları
reenter in case fake stoploss hit. range bond will increase your trades so use another indicator to find trend.Açık kaynak kodlu komut dosyası
Gerçek TradingView ruhuyla, bu komut dosyasının mimarı, yatırımcıların işlevselliğini inceleyip doğrulayabilmesi için onu açık kaynaklı hale getirdi. Yazarı tebrik ederiz! Ücretsiz olarak kullanabilseniz de, kodu yeniden yayınlamanın Topluluk Kurallarımıza tabi olduğunu unutmayın.
Feragatname
Bilgiler ve yayınlar, TradingView tarafından sağlanan veya onaylanan finansal, yatırım, alım satım veya diğer türden tavsiye veya öneriler anlamına gelmez ve teşkil etmez. Kullanım Koşulları bölümünde daha fazlasını okuyun.
Açık kaynak kodlu komut dosyası
Gerçek TradingView ruhuyla, bu komut dosyasının mimarı, yatırımcıların işlevselliğini inceleyip doğrulayabilmesi için onu açık kaynaklı hale getirdi. Yazarı tebrik ederiz! Ücretsiz olarak kullanabilseniz de, kodu yeniden yayınlamanın Topluluk Kurallarımıza tabi olduğunu unutmayın.
Feragatname
Bilgiler ve yayınlar, TradingView tarafından sağlanan veya onaylanan finansal, yatırım, alım satım veya diğer türden tavsiye veya öneriler anlamına gelmez ve teşkil etmez. Kullanım Koşulları bölümünde daha fazlasını okuyun.