OPEN-SOURCE SCRIPT
EMA Crossover Visual Setup (RS Clásico Confirmado)
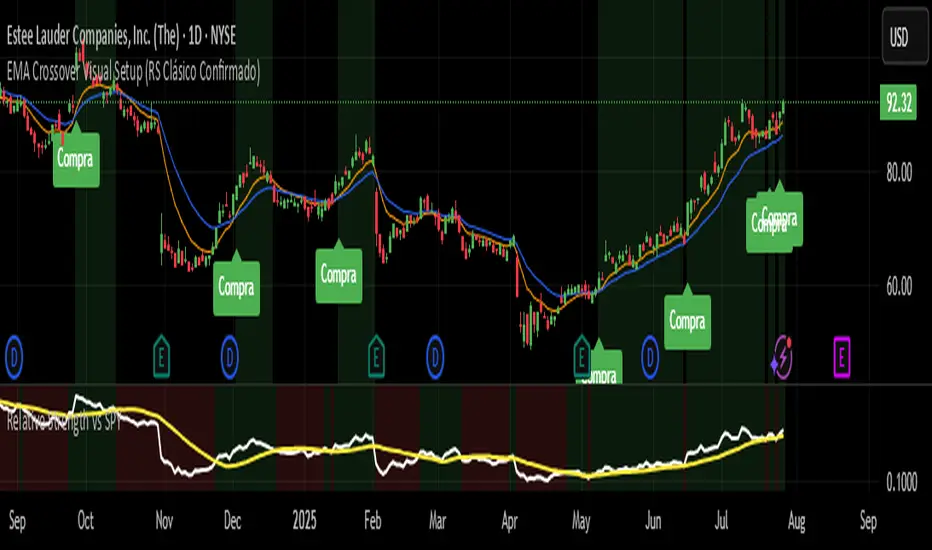
Overview
This script is designed to visually highlight classic swing trading setups based on the crossover of exponential moving averages (EMAs), with additional confirmation using Relative Strength (RS) compared to a benchmark asset (e.g., SPY).
The goal is to identify bullish momentum shifts that align both with technical structure (EMA crossover) and relative outperformance, helping traders focus on strong stocks in strong markets.
Logic
A signal is triggered when the following conditions are met:
The fast EMA (e.g., 10) crosses above the slow EMA (e.g., 20).
The closing price is above a third EMA (e.g., 50) to confirm bullish structure.
The asset's Relative Strength (RS) versus a benchmark is confirmed manually, based on an RSI comparison (not calculated inside the script).
The script is meant to be used alongside manual RS confirmation, using a secondary chart or overlay of the RS ratio.
Features
Visual labels and markers for clean charting of valid entry setups
Fully customizable EMA lengths
Optional highlighting of candle patterns near entry
Ideal for use with top-down analysis and watchlist filtering
Suggested Use
Works best on daily and 4H charts for swing trading setups
Combine with volume and price action analysis for higher probability trades
Use manual RS validation: confirm that the RSI of the selected stock is stronger than the RSI of SPY (or any benchmark of your choice)
Notes
This script does not execute trades or include stop loss/take profit logic, as it is intended for discretionary traders who want to visually scan for opportunities.
It also does not calculate RS internally, allowing flexibility in how you define strength (RS line, RSI comparison, or price ratio).
Açık kaynak kodlu komut dosyası
Gerçek TradingView ruhuyla, bu komut dosyasının mimarı, yatırımcıların işlevselliğini inceleyip doğrulayabilmesi için onu açık kaynaklı hale getirdi. Yazarı tebrik ederiz! Ücretsiz olarak kullanabilseniz de, kodu yeniden yayınlamanın Topluluk Kurallarımıza tabi olduğunu unutmayın.
Feragatname
Bilgiler ve yayınlar, TradingView tarafından sağlanan veya onaylanan finansal, yatırım, alım satım veya diğer türden tavsiye veya öneriler anlamına gelmez ve teşkil etmez. Kullanım Koşulları bölümünde daha fazlasını okuyun.