OPEN-SOURCE SCRIPT
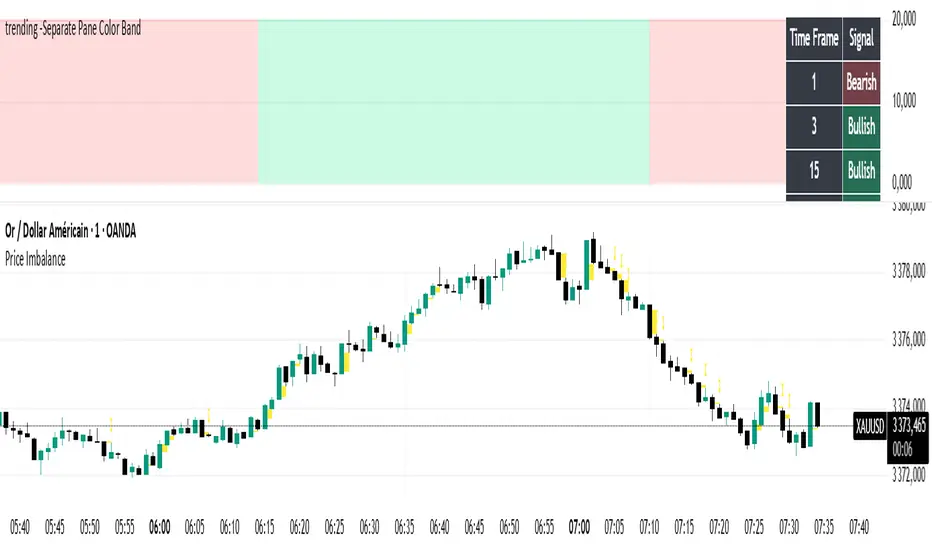
trending -Separate Pane Color Band
The "Donchian trendi multi time frame Color Band" is designed to identify trend directions based on swing highs and lows (similar to Donchian channel concepts, where trends are determined by breakouts from recent highs/lows). The indicator operates in a separate pane (overlay = false) and primarily visualizes:

Trend Direction: Determined by the relative positions of the most recent swing high and swing low. If the last swing high occurred after the last swing low, it's considered an uptrend (bullish); otherwise, a downtrend (bearish).
Adaptive Trend Band: A colored area plot in the indicator pane that represents an adaptive tracking period (influenced by volatility if enabled), filled with a color indicating the current trend (green for up, red for down).
Multi-Timeframe (MTF) Table: An optional table displayed in the top-right corner, showing the trend signal (Bullish or Bearish) for up to 6 user-defined higher timeframes. Each cell is colored based on the trend.
The indicator uses swing detection to gauge trend, incorporates optional volatility-based adaptation for responsiveness, and focuses on multi-timeframe analysis for broader market context. It's not a direct Donchian channel (which typically plots upper/lower bands), but borrows the idea of using highest/lowest prices over a period to detect pivots. It doesn't generate buy/sell signals explicitly but can be used for trend confirmation across timeframes.
Key features include tooltips for inputs, making it user-friendly, and limits on bars/labels for performance.
Key Inputs and Their Roles
The indicator provides customizable inputs grouped into "Swing Points", "Style", and "Multi Timeframe". Here's a breakdown:
Swing Period (prd): Default 50, minimum 2. This sets the lookback period (in bars) for identifying swing highs and lows. Higher values capture major swings (less noise, more lag); lower values detect minor swings (more responsive, but noisier).
Adaptive Price Tracking (baseAPT): Default 20, minimum 1. This base value controls the responsiveness of an adaptive tracking mechanism (similar to a VWAP or moving average length). Lower values make it tighter to price action; higher values smooth it out.
Adapt APT by ATR ratio (useAdapt): Default false. If enabled, the tracking period dynamically adjusts based on market volatility (measured via ATR - Average True Range). High volatility shortens the period for faster reaction; low volatility lengthens it for smoothness.
Volatility Bias (volBias): Default 10.0, minimum 0.1. This amplifies or dampens how much volatility affects the adaptive tracking. Values >1 make it more sensitive to volatility changes; <1 make it less reactive.
Up Color (S): Default lime (green). Color for bullish trends in the band and table.
Down Color (R): Default red. Color for bearish trends in the band and table.
Show MTF Table (show_table): Default true. Toggles the display of the multi-timeframe trend table.
Time frames (tf1 to tf6): Defaults: '1' (1-minute), '3' (3-minute), '15' (15-minute), '60' (1-hour), '240' (4-hour), 'D' (daily). These are the higher timeframes for which trend directions are calculated and shown in the table.
Usage and Interpretation
On the Chart: Add this to a TradingView chart (e.g., for stocks, crypto, forex). The colored area in the indicator pane shows the current timeframe's trend: green band = bullish, red = bearish. The band's height reflects the adaptive period (wider in low volatility if adaptation is on).
MTF Table: Use this for alignment across timeframes. If most/higher timeframes are bullish, it might confirm an uptrend on the current chart. Ideal for trend-following strategies (e.g., trade in the direction of higher TFs).
Customization Tips:
Increase prd for longer-term trends.
Enable useAdapt in choppy markets for better responsiveness.
Adjust timeframes to match your trading style (e.g., scalping: lower TFs; swing: higher).
Limitations:
Relies on historical bars (max_bars_back=5000), so it may not load on very long charts.
No alerts or signals built-in; it's visual-only.
The "Donchian" in the name is loose—it's more pivot-based than full channels.
Adaptation uses ATR, which assumes volatility drives trend responsiveness, but may lag in ranging markets.
Açık kaynak kodlu komut dosyası
Gerçek TradingView ruhuna uygun olarak, bu komut dosyasının oluşturucusu bunu açık kaynaklı hale getirmiştir, böylece yatırımcılar betiğin işlevselliğini inceleyip doğrulayabilir. Yazara saygı! Ücretsiz olarak kullanabilirsiniz, ancak kodu yeniden yayınlamanın Site Kurallarımıza tabi olduğunu unutmayın.
Feragatname
Bilgiler ve yayınlar, TradingView tarafından sağlanan veya onaylanan finansal, yatırım, işlem veya diğer türden tavsiye veya tavsiyeler anlamına gelmez ve teşkil etmez. Kullanım Şartları'nda daha fazlasını okuyun.