OPEN-SOURCE SCRIPT
Laguerre Stochastic | Adulari
Description:
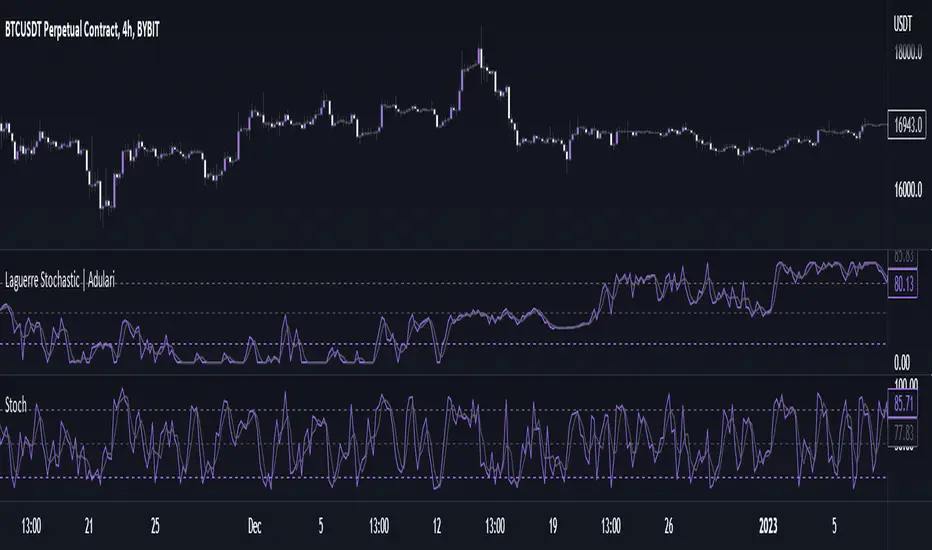
The Laguerre Stochastic is similar to a 4-period regular Stochastic, except that a Laguerre transform has been applied for price smoothing. The Laguerre transform is a mathematical technique that allows smooth indicators to be built using small amounts of data.
How do I use it?
Features:
How does it work?
1 — Calculate regular Stochastic value.
2 — Apply the Laguerre transform.
3 — Calculate %D value by applying smoothing to the %K value.
The Laguerre Stochastic is similar to a 4-period regular Stochastic, except that a Laguerre transform has been applied for price smoothing. The Laguerre transform is a mathematical technique that allows smooth indicators to be built using small amounts of data.
How do I use it?
- Never use this indicator as standalone trading signal, it should be used as confluence.
- When the value is above the middle line this shows the bullish trend is strong.
- When the value is below the middle line this shows the bearish trend is strong.
- When the value crosses above the upper line this indicates the trend may reverse downwards.
- When the value crosses below the lower line this indicates the trend may reverse upwards.
- When the value crosses above the signal this indicates the current bearish trend is getting weak and may reverse upwards.
- When the value crosses below the signal this indicates the current bullish trend is getting weak and may reverse downwards.
Features:
- Oscillator value indicating the difference between highs and lows fractioned by the close price.
- %D value acting as a smoothed version of the %K.
- Horizontal lines such as oversold, overbought and middle lines, indicating possible interest zones.
How does it work?
1 — Calculate regular Stochastic value.
2 — Apply the Laguerre transform.
3 — Calculate %D value by applying smoothing to the %K value.
Açık kaynak kodlu komut dosyası
Gerçek TradingView ruhuyla, bu komut dosyasının mimarı, yatırımcıların işlevselliğini inceleyip doğrulayabilmesi için onu açık kaynaklı hale getirdi. Yazarı tebrik ederiz! Ücretsiz olarak kullanabilseniz de, kodu yeniden yayınlamanın Topluluk Kurallarımıza tabi olduğunu unutmayın.
Feragatname
Bilgiler ve yayınlar, TradingView tarafından sağlanan veya onaylanan finansal, yatırım, alım satım veya diğer türden tavsiye veya öneriler anlamına gelmez ve teşkil etmez. Kullanım Koşulları bölümünde daha fazlasını okuyun.