OPEN-SOURCE SCRIPT
Breakout Swing High Low
This open-source indicator identifies swing high and swing low breakouts, providing clear visual signals for potential trend entries. It is designed for traders who use price action to spot breakout opportunities in trending markets.
How It Works
Swing Detection: The indicator uses a user-defined lookback period (default: 4 candles) to identify swing highs (peaks) and swing lows (troughs). A swing high is confirmed when a candle's high is higher than the surrounding candles, and a swing low is confirmed when a candle's low is lower.
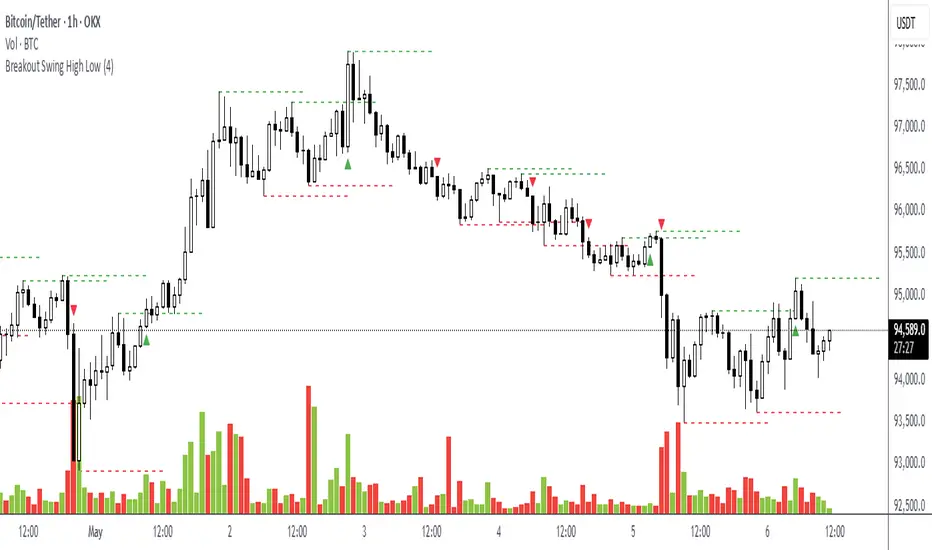
Breakout Signals: A green triangle below the candle signals a breakout above the most recent swing high, indicating a potential buy opportunity. A red triangle above the candle signals a breakout below the most recent swing low, indicating a potential sell opportunity. Each swing level triggers only one breakout signal to avoid clutter.
Visualization: Swing high levels are drawn as green dashed lines, and swing low levels as red dashed lines, extending 15 candles for clarity. Breakout signals are marked with small triangles.
How to Use
Apply the Indicator: Add the indicator to your TradingView chart.
Adjust Lookback: Set the "Lookback Candles" input (default: 4) to control the sensitivity of swing detection. Smaller values detect shorter-term swings, while larger values identify more significant levels.
Interpret Signals:
Green triangle (below candle): Consider a buy opportunity when price breaks above a swing high.
Red triangle (above candle): Consider a sell opportunity when price breaks below a swing low.
Combine with Other Tools: Use in conjunction with trend indicators (e.g., 50-period EMA) or support/resistance levels to filter signals in trending markets.
Timeframes: Works best on higher timeframes (e.g., 1H, 4H) in trending markets to avoid false breakouts in sideways conditions.
How It Works
Swing Detection: The indicator uses a user-defined lookback period (default: 4 candles) to identify swing highs (peaks) and swing lows (troughs). A swing high is confirmed when a candle's high is higher than the surrounding candles, and a swing low is confirmed when a candle's low is lower.
Breakout Signals: A green triangle below the candle signals a breakout above the most recent swing high, indicating a potential buy opportunity. A red triangle above the candle signals a breakout below the most recent swing low, indicating a potential sell opportunity. Each swing level triggers only one breakout signal to avoid clutter.
Visualization: Swing high levels are drawn as green dashed lines, and swing low levels as red dashed lines, extending 15 candles for clarity. Breakout signals are marked with small triangles.
How to Use
Apply the Indicator: Add the indicator to your TradingView chart.
Adjust Lookback: Set the "Lookback Candles" input (default: 4) to control the sensitivity of swing detection. Smaller values detect shorter-term swings, while larger values identify more significant levels.
Interpret Signals:
Green triangle (below candle): Consider a buy opportunity when price breaks above a swing high.
Red triangle (above candle): Consider a sell opportunity when price breaks below a swing low.
Combine with Other Tools: Use in conjunction with trend indicators (e.g., 50-period EMA) or support/resistance levels to filter signals in trending markets.
Timeframes: Works best on higher timeframes (e.g., 1H, 4H) in trending markets to avoid false breakouts in sideways conditions.
Açık kaynak kodlu komut dosyası
Gerçek TradingView ruhuyla, bu komut dosyasının mimarı, yatırımcıların işlevselliğini inceleyip doğrulayabilmesi için onu açık kaynaklı hale getirdi. Yazarı tebrik ederiz! Ücretsiz olarak kullanabilseniz de, kodu yeniden yayınlamanın Topluluk Kurallarımıza tabi olduğunu unutmayın.
Feragatname
Bilgiler ve yayınlar, TradingView tarafından sağlanan veya onaylanan finansal, yatırım, alım satım veya diğer türden tavsiye veya öneriler anlamına gelmez ve teşkil etmez. Kullanım Koşulları bölümünde daha fazlasını okuyun.