vdubus

VDUB_BINARY_PRO_3_V2 FINAL + Strategy

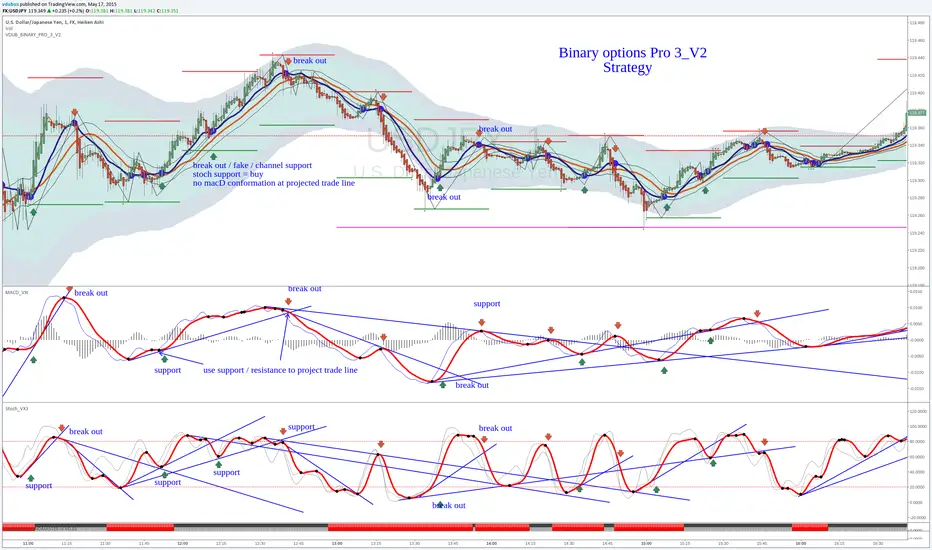
VDUB_BINARY_PRO_3_V2 - FINAL

*stripped out a couple of things from V1 - found it was to noisy
*added Baseline_VX1
*switch period channels around
*zigzag
Optional- set centre band to '34 to run centre line

other indicators to include
MACD_VX1 Stoch_VX3


Açık kaynak kodlu komut dosyası

Gerçek TradingView ruhuyla, bu betiğin yazarı, yatırımcının anlayabilmesi ve doğrulayabilmesi için onu açık kaynak olarak yayınladı. Yazarın eline sağlık! Bunu ücretsiz olarak kullanabilirsiniz, ancak bu kodun bir yayında yeniden kullanımı Kullanım Koşulları ile yönetilir. Bir grafikte kullanmak için favorilere ekleyebilirsiniz.

Feragatname

Bilgiler ve yayınlar, TradingView tarafından sağlanan veya onaylanan finansal, yatırım, işlem veya diğer türden tavsiye veya tavsiyeler anlamına gelmez ve teşkil etmez. Kullanım Şartları'nda daha fazlasını okuyun.

Bu komut dosyasını bir grafikte kullanmak ister misiniz?
study(title="VDUB_BINARY_PRO_3_V2", shorttitle="VDUB_BINARY_PRO_3_V2", overlay=true)
source = close
length = input(56, minval=1, title = "WMA Length")
atrlen = input(100, minval=1, title = "ATR Length")
mult1 = 2
mult2 = 3
ma = wma(source, length)
range =  tr
rangema = wma(range, atrlen)

up1 = ma + rangema * mult1
up2 = ma + rangema * mult2

dn1 = ma - rangema * mult1
dn2 = ma - rangema * mult2

color1 = white
color2 = white

u4 = plot(up1, color = color1)
u8 = plot(up2, color = color2)

d4 = plot(dn1, color = color1)
d8 = plot(dn2, color = color2)

fill(u8, u4, color=#30628E, transp=80)
fill(d8, d4, color=#30628E, transp=80)
fill(d4, u4, color=#128E89, transp=80)

//Linear regression band
src = close
//Input
nlookback = input (defval = 20, minval = 1, title = "Number of Lookback")
scale = input(defval=1,  title="scale of ATR")
nATR = input(defval = 14, title="ATR Parameter")

//Center band
periods=input(21, minval=1, title="MA Period")
pc = input(true, title="MA BAND")

hld = iff(close > sma(high,periods)[1], 1, iff(close<sma(low,periods)[1],-1, 0))
hlv = valuewhen(hld != 0, hld, 1)

hi = pc and hlv == -1 ? sma(high, periods) : na
lo = pc and hlv == 1 ? sma(low,periods) : na
plot(avg(sma(high,periods)+2.5*(sma(high,periods)-sma(low,periods)),sma(low,periods)-2.5*(sma(high,periods)-sma(low,periods))), color=red, style=line,linewidth=4)
plot(pc and sma(high, periods) ? sma(high, periods):na ,title="Swing High Plot", color=black,style=line, linewidth=1)
plot(pc and sma(low,periods) ? sma(low,periods) : na ,title="Swing Low Plot", color=black,style=line, linewidth=1)
//fill(hlv,hld,color=#1c86ee,transp=80)
//--------------------------------------------------------------------------------------------
// Base line_VX1
source2 = close
short = sma(close, 3)
long = sma(close, 13)
plot(short, color=red, linewidth=2)
plot(long, color=navy, linewidth=4)
plot(cross(long, short) ? long : na, style = circles, color=blue, linewidth = 9)
OutputSignal = long >= short ? 1 : 0
bgcolor(OutputSignal>0?red:gray, transp=100)
//=======================================================
//Vdub_Tetris_V2
LRG_Channel_TF_mins_D_W_M = input("30")
Range2 = input(1)

SELL = security(tickerid, LRG_Channel_TF_mins_D_W_M, highest(Range2))
BUY = security(tickerid, LRG_Channel_TF_mins_D_W_M, lowest(Range2))

HI = plot(SELL, color=SELL!=SELL[1]?na:red,linewidth=2 )
LO = plot(BUY, color=BUY!=BUY[1]?na:green,linewidth=2 )
fill(HI, LO, color=#E3CAF1, transp=100)
Hcon = high >= SELL
Lcon = low <= BUY

plotshape(Hcon, style=shape.triangledown, color=maroon, location=location.abovebar)
plotshape(Lcon, style=shape.triangleup, color=green, location=location.belowbar)
range2 = SELL-BUY
//--------------------------------------------------

SML_Channel_TF_mins_D_W_M = input('240')
M_HIGH = security(tickerid, SML_Channel_TF_mins_D_W_M, high)
M_LOW = security(tickerid, SML_Channel_TF_mins_D_W_M, low)
plot(M_HIGH, color=M_HIGH != M_HIGH[1] ?na:fuchsia, style=line, linewidth=2)
plot(M_LOW, color=M_LOW != M_LOW[1] ?na:fuchsia, style=line, linewidth=2)
//--------------------------------------------------
Zingzag_length = input(7)
hls = rma(hl2, Zingzag_length)
isRising = hls >= hls[1]

zigzag1 = isRising and not isRising[1] ? lowest(Zingzag_length) :  not isRising and isRising[1] ? highest(Zingzag_length) : na
plot(zigzag1, color=black)

Zigzag2 = input(false)
zigzag = Hcon ? high : Lcon ? low : na
plot(not Zigzag2 ? na : zigzag, color=red, style=line, linewidth=3)

//=====================================================================//