OPEN-SOURCE SCRIPT
MTF Swing Highs/Lows
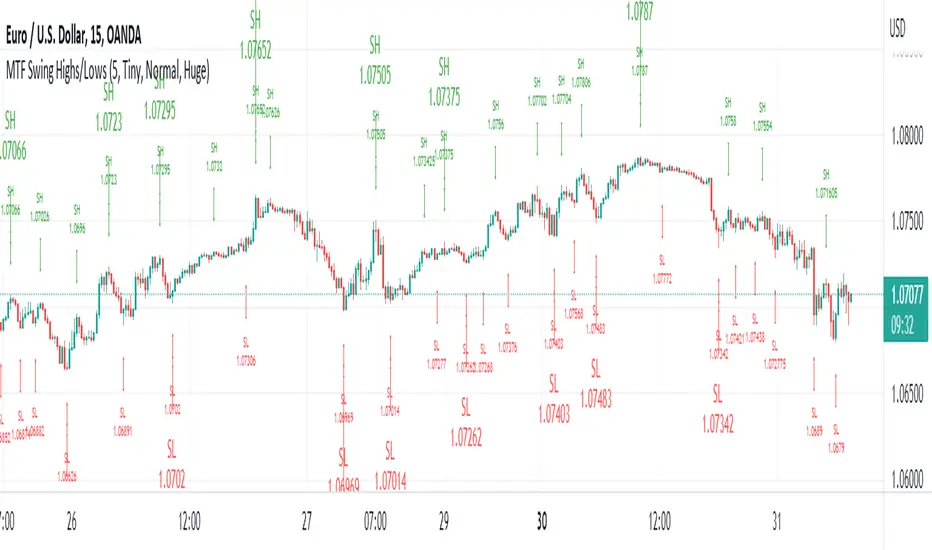
I designed this indicator out of necessity for the Market structure/Price action trading strategy I use.
I thought I'd share. :)
This indicator displays Swing Highs and Lows an 3 timeframes based on the Chart timeframe, as follows:
Chart TF Higher TF Highest TF
1m 5m 15m
5m 15m 60m
15m 60m 240m
60m 240m Daily
You can change the font size of the labels as you'd prefer.
I thought I'd share. :)
This indicator displays Swing Highs and Lows an 3 timeframes based on the Chart timeframe, as follows:
Chart TF Higher TF Highest TF
1m 5m 15m
5m 15m 60m
15m 60m 240m
60m 240m Daily
You can change the font size of the labels as you'd prefer.
Açık kaynak kodlu komut dosyası
Gerçek TradingView ruhuyla, bu komut dosyasının yaratıcısı, yatırımcıların işlevselliğini inceleyip doğrulayabilmesi için onu açık kaynaklı hale getirdi. Yazarı tebrik ederiz! Ücretsiz olarak kullanabilseniz de, kodu yeniden yayınlamanın Topluluk Kurallarımıza tabi olduğunu unutmayın.
Feragatname
Bilgiler ve yayınlar, TradingView tarafından sağlanan veya onaylanan finansal, yatırım, alım satım veya diğer türden tavsiye veya öneriler anlamına gelmez ve teşkil etmez. Kullanım Koşulları bölümünde daha fazlasını okuyun.