OPEN-SOURCE SCRIPT
DT Dual-Lookback DLB
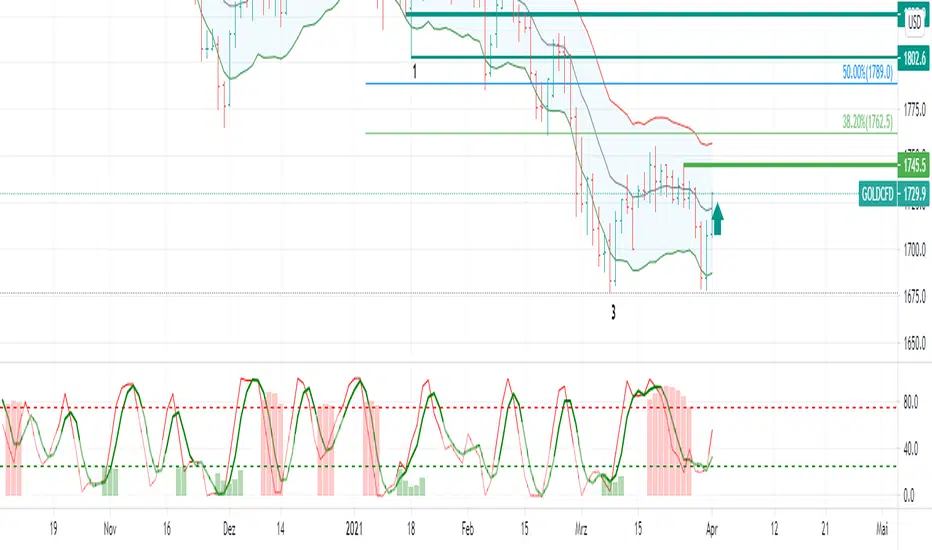
This script is based on the concept of Robert Miner Book "High Probabilities Strategies"
This script shows at the same time two timeframes and the overlapping area.
The green and red area shows the higher time frame period just as Robert Miner did this in his videos.
Because Robert Miner just says: 8.. 13.. 21.. i used this also as type for the setup.
This is not a complete trading strategy, but if fibonacci retracement/extensions in price and time and
elliot waves position and DT Dual-Lookback comed together there is a perhaps a signal.
Please read his book and look at his website and his DT reports to learn more about his strategy.
Açık kaynak kodlu komut dosyası
Gerçek TradingView ruhuyla, bu komut dosyasının mimarı, yatırımcıların işlevselliğini inceleyip doğrulayabilmesi için onu açık kaynaklı hale getirdi. Yazarı tebrik ederiz! Ücretsiz olarak kullanabilseniz de, kodu yeniden yayınlamanın Topluluk Kurallarımıza tabi olduğunu unutmayın.
Feragatname
Bilgiler ve yayınlar, TradingView tarafından sağlanan veya onaylanan finansal, yatırım, alım satım veya diğer türden tavsiye veya öneriler anlamına gelmez ve teşkil etmez. Kullanım Koşulları bölümünde daha fazlasını okuyun.