OPEN-SOURCE SCRIPT
TOTAL:(RSI+TSI)
TOTAL:(RSI+TSI)
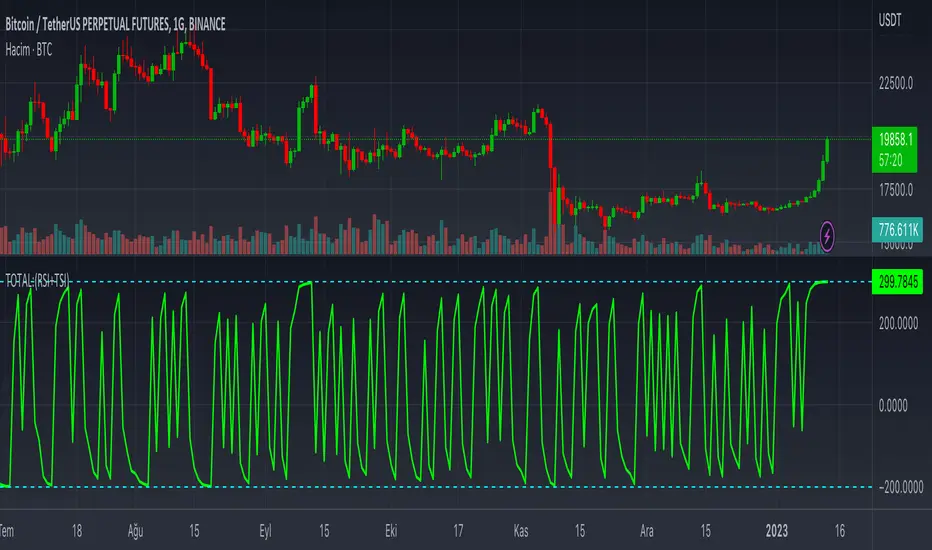
This indicator collects instant data of RSI and TSI oscillators. RSI moves between (0) and (100) values as a moving line, while TSI moves between (-100) and (+100) values as two moving lines.
The top value of the sum of these values is graphically;
It takes the total value (+300) from RSI (+100), TSI (+100) and (+100).
The lowest value of the sum of these values is graphically;
It takes the value (-200) from the RSI (0), (-100) and (-100) from the TSI.
In case this indicator approaches (+300) graphically; It can be seen that price candlesticks mostly move upwards. This may not always give accurate results. Past incompatibilities can affect this situation.
In case this indicator approaches (-200) graphically; It can be seen that price candlesticks mostly move downwards. This may not always give accurate results. Past incompatibilities can affect this situation.
The graphical movements and numerical values created by this indicator do not give precise results for price candles.
Açık kaynak kodlu komut dosyası
Gerçek TradingView ruhuna uygun olarak, bu komut dosyasının oluşturucusu bunu açık kaynaklı hale getirmiştir, böylece yatırımcılar betiğin işlevselliğini inceleyip doğrulayabilir. Yazara saygı! Ücretsiz olarak kullanabilirsiniz, ancak kodu yeniden yayınlamanın Site Kurallarımıza tabi olduğunu unutmayın.
Feragatname
Bilgiler ve yayınlar, TradingView tarafından sağlanan veya onaylanan finansal, yatırım, işlem veya diğer türden tavsiye veya tavsiyeler anlamına gelmez ve teşkil etmez. Kullanım Şartları'nda daha fazlasını okuyun.