OPEN-SOURCE SCRIPT
Güncellendi Trend Flow Oscillator (CMF + MFI) + ADX
## Trend Flow Oscillator (TFO + ADX) Indicator Description
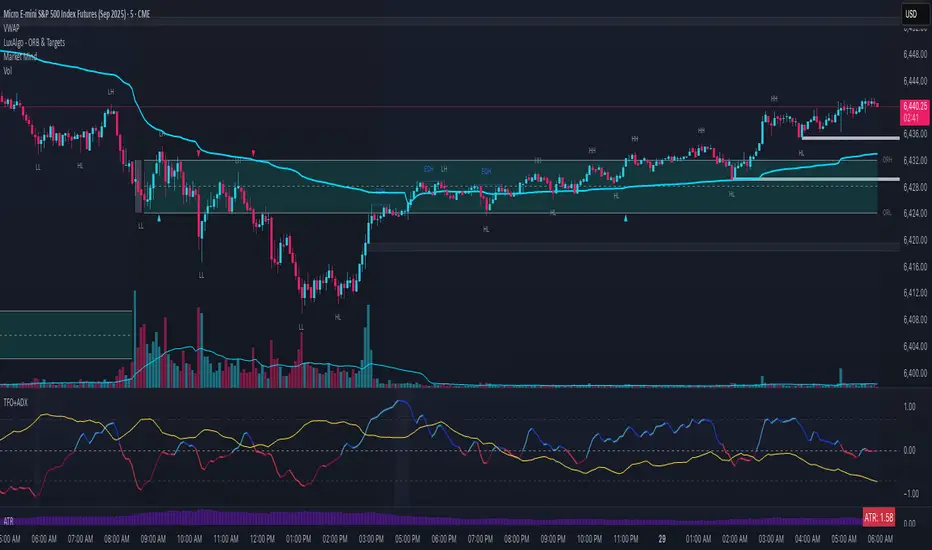
The Trend Flow Oscillator (TFO+ADX) combines two volume-based indicators, Money Flow Index (MFI) and Chaikin Money Flow (CMF), along with the Average Directional Index (ADX) into one comprehensive oscillator. This indicator provides traders with insights into momentum, volume flow, and trend strength, clearly indicating bullish or bearish market conditions.
### How the Indicator Works:
1. **Money Flow Index (MFI)**:
* Measures buying and selling pressure based on price and volume.
* Scaled from -1 to +1 (where positive values indicate buying pressure, negative values indicate selling pressure).
2. **Chaikin Money Flow (CMF)**:
* Evaluates money flow volume over a set period, reflecting institutional buying or selling.
* Also scaled from -1 to +1 (positive values suggest bullish accumulation, negative values bearish distribution).
3. **Average Directional Index (ADX)**:
* Measures trend strength, indicating whether a market is trending or ranging.
* Scaled from -1 to +1, with values above 0 suggesting strong trends, and values near or below 0 indicating weak trends or sideways markets.
* Specifically, an ADX value of 0 means neutral trend strength; positive values indicate a strong trend.
### Indicator Levels and Interpretation:
* **Zero Line (0)**: Indicates neutral conditions. When the oscillator crosses above zero, it signals increasing bullish momentum; crossing below zero indicates bearish momentum.
* **Extreme Zones (+/- 0.75)**:
* Oscillator values above +0.75 are considered overbought or highly bullish.
* Oscillator values below -0.75 are considered oversold or highly bearish.
* The indicator features subtle background shading to visually highlight these extreme momentum areas for quick identification.
* Shading when values above or below the +/-1.0 level.
* **Color Coding**:
* Bright blue indicates strengthening bullish momentum.
* Dark blue signals weakening bullish momentum.
* Bright red indicates strengthening bearish momentum.
* Dark maroon signals weakening bearish momentum.
Sürüm Notları
// UPDATE: This indicator has been replaced//I've significantly simplified and improved this concept. The "Pro" version became overly complex with features that didn't add real value.
//Check out the new Flow Control Oscillator (FCO) instead:
//

//The FCO keeps what worked (MFI + CMF + ADX weighting) and removes the unnecessary complexity. Cleaner, more reliable signals for intraday trading.
Açık kaynak kodlu komut dosyası
Gerçek TradingView ruhuyla, bu komut dosyasının mimarı, yatırımcıların işlevselliğini inceleyip doğrulayabilmesi için onu açık kaynaklı hale getirdi. Yazarı tebrik ederiz! Ücretsiz olarak kullanabilseniz de, kodu yeniden yayınlamanın Topluluk Kurallarımıza tabi olduğunu unutmayın.
Feragatname
Bilgiler ve yayınlar, TradingView tarafından sağlanan veya onaylanan finansal, yatırım, alım satım veya diğer türden tavsiye veya öneriler anlamına gelmez ve teşkil etmez. Kullanım Koşulları bölümünde daha fazlasını okuyun.