PROTECTED SOURCE SCRIPT
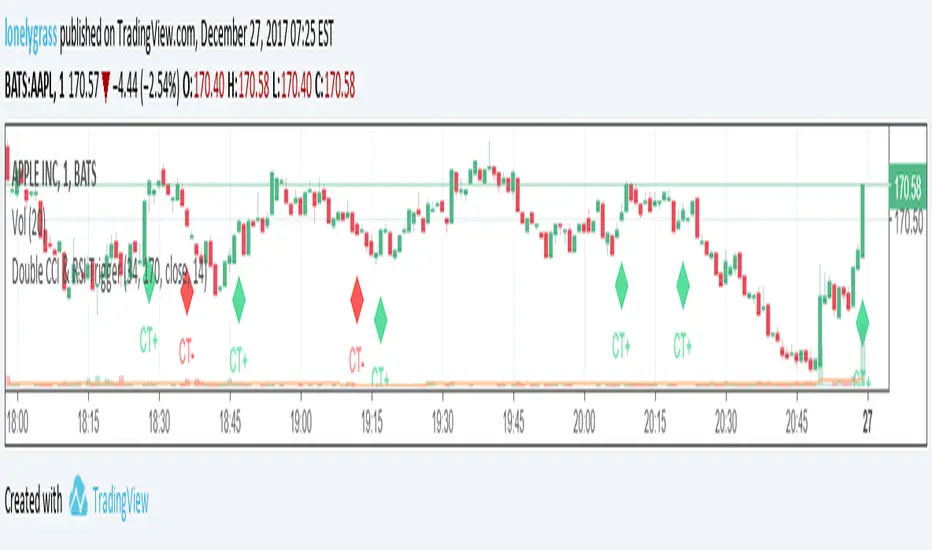
Double CCI & RSI Trigger

Warning : This strategy can only be implemented with 1 minute timeframe chart
With the help of 2 CCI and 1 RSI, it is much easier to identify the market trend. The main idea of this EA is looking at a longer CCI (170 periods) and RSI (14 periods) and finding some possible bullish and bearish trends.
Bullish Conditions: 170 CCI has a value of above 0 and RSI 14 is larger than 30 (oversold)
Bearish Conditions: 170 CCI has a value of below 0 and RSI 14 is lower than 70 (overbought)
When conditions are met, CT+ (bullish) and CT- (bearish) signals will be shown on the graph.
To effectively adopt the system, users have to incorporate "Double CCI & RSI Alert" , my another script, into this and can decide whether or not to hold onto positions. Happy trading! Appreciate support and comments!
Korumalı komut dosyası
Bu komut dosyası kapalı kaynak olarak yayınlanmaktadır. Ancak, ücretsiz ve herhangi bir sınırlama olmaksızın kullanabilirsiniz – daha fazla bilgiyi buradan edinebilirsiniz.
Feragatname
Bilgiler ve yayınlar, TradingView tarafından sağlanan veya onaylanan finansal, yatırım, alım satım veya diğer türden tavsiye veya öneriler anlamına gelmez ve teşkil etmez. Kullanım Koşulları bölümünde daha fazlasını okuyun.