OPEN-SOURCE SCRIPT
Co-Relation by Onur
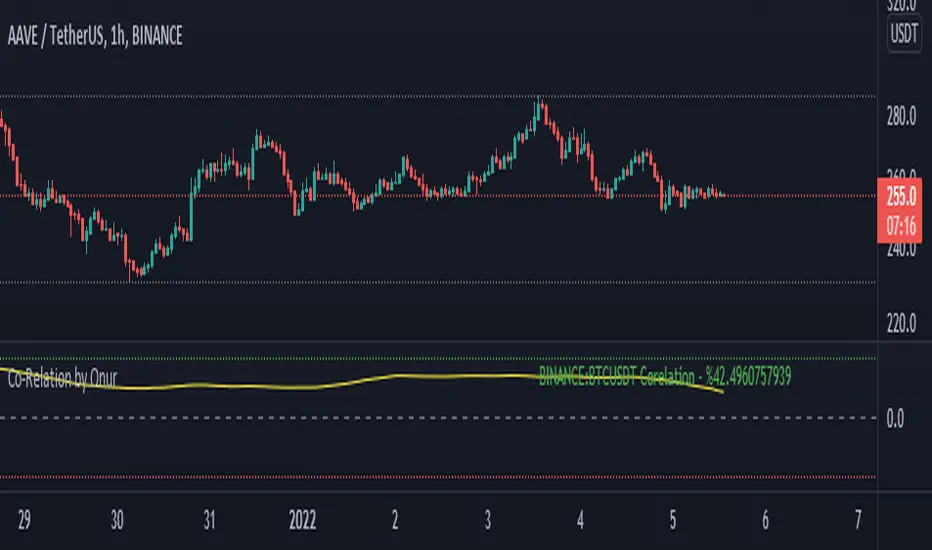
This indicator can statistically compare ANY asset in Tradingview with the asset in the active chart. It helps to understand positive or negative corelation btw 2 assets with percentage. Indicator value oscillates btw +100 and -100. If value is close to +100, there is a positive co-relation and if value is close to -100, there is a negative co-relation.
Indicator has 2 variables:
Symbol: The symbol (BTCUSDT by Default) that you'd like to compare with chart.
Period: Is the number of backward candles (200 by Default) for indicator co-relation calculation.
You can increase Period value to understand a long term relationship btw 2 assets.
Indicator has 2 variables:
Symbol: The symbol (BTCUSDT by Default) that you'd like to compare with chart.
Period: Is the number of backward candles (200 by Default) for indicator co-relation calculation.
You can increase Period value to understand a long term relationship btw 2 assets.
Açık kaynak kodlu komut dosyası
Gerçek TradingView ruhuyla, bu komut dosyasının mimarı, yatırımcıların işlevselliğini inceleyip doğrulayabilmesi için onu açık kaynaklı hale getirdi. Yazarı tebrik ederiz! Ücretsiz olarak kullanabilseniz de, kodu yeniden yayınlamanın Topluluk Kurallarımıza tabi olduğunu unutmayın.
Feragatname
Bilgiler ve yayınlar, TradingView tarafından sağlanan veya onaylanan finansal, yatırım, alım satım veya diğer türden tavsiye veya öneriler anlamına gelmez ve teşkil etmez. Kullanım Koşulları bölümünde daha fazlasını okuyun.