OPEN-SOURCE SCRIPT
The Kyber Cell's – TTM Wave B
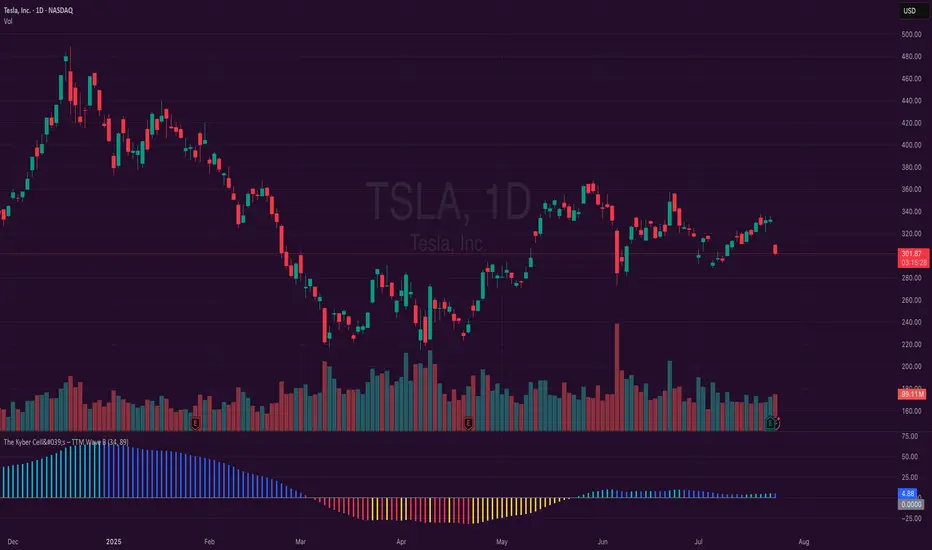
Kyber Cell’s Wave B – TTM Squeeze Trend Confirmation Histogram
⸻
1. Introduction
Wave B acts as the trend validator in the TTM Squeeze suite. While Wave A reveals the heartbeat of momentum, Wave B focuses on the directional stability of price. It answers a critical question for traders: Is the trend in my favor, or am I trading against the dominant force?
Built for confirming entries and filtering out low-probability setups, Kyber Cell’s Wave B applies a smoother, more deliberate view of trend structure using configurable moving average logic. This makes it ideal for preventing false starts and improving trade alignment — particularly in combination with Wave A and squeeze-fire signals.
⸻
2. Core Concept and Calculation
Unlike Wave A, which tracks short-term price bursts, Wave B focuses on trend direction and consistency. It typically derives its signal from one of two engines:
• EMA-Based Method: Compares short-term EMA (e.g., 8) to a longer EMA (e.g., 21) to determine directional bias.
• HMA-Based Method: Measures slope and crossover behavior between fast and slow Hull Moving Averages (e.g., HMA 34 and HMA 144) for a smoother trend read.
These calculations produce a histogram that doesn’t fluctuate rapidly like Wave A, but instead stabilizes around sustained trend strength. As such, Wave B excels at confirming whether a move has backing from the broader market structure.
⸻
3. Visual Output and Color Logic
Wave B uses a 3-color histogram to clearly define trend state:
• Bright Blue: Bullish trend
• Bright Red: Bearish trend
• Gray: Neutral or transitioning state (indecision)
This simplified color scheme helps traders avoid information overload and focus on whether the market is structurally aligned for long or short entries.
• When paired with a squeeze-fire and rising Wave A, a blue Wave B bar signals strong confirmation to go long.
• Conversely, a red Wave B bar during a squeeze-fire and falling Wave A confirms bearish setups.
• A gray bar typically signals trend conflict, indecision, or transitional environments — and should be treated as a caution flag.
⸻
4. Ideal Use Case
Wave B is best used as a filter and confirmation layer in your trading workflow:
1. Identify a squeeze setup (using Squeeze Pro or dots indicator).
2. Confirm with Wave A: Look for a fresh momentum push (cyan or red bars).
3. Validate with Wave B:
• Only take long trades when Wave B is blue.
• Only take short trades when Wave B is red.
• Avoid or delay trades when Wave B is gray.
4. Ride the trend until Wave B flips or Wave A fades.
This reduces emotional decision-making and keeps your trades aligned with the prevailing bias, especially on higher timeframes or in choppy conditions.
⸻
5. Configuration and Customization
Wave B is designed with enough flexibility to adapt to different trading styles while remaining streamlined:
• Trend Engine Selection: Choose between EMA-based or HMA-based logic.
• Moving Average Lengths: Customize the short- and long-term periods.
• Color Customization: Adjust bar colors to match your chart theme or visibility needs.
• Bar Thickness and Positioning: Optional visual tweaks depending on your chart layout.
The goal is to provide just enough configurability to integrate seamlessly with Wave A and Squeeze Pro, without diluting the core purpose: trend clarity.
⸻
6. Alerts and Add-ons
Wave B can be extended with basic or advanced alerts, depending on your needs:
• Alert on trend flips (blue → red or red → blue)
• Alert on return to neutral (gray bars)
• Combined alerts with squeeze and momentum signals for high-confluence trades
When integrated with other components, Wave B becomes an essential part of a multi-layered confirmation system.
⸻
7. Disclaimer
This indicator is provided for educational purposes only and is not financial advice. No trading decision should be made solely on the basis of this tool. All users should test their strategies, assess their own risk tolerance, and consider using Wave B as part of a broader technical framework.
⸻
1. Introduction
Wave B acts as the trend validator in the TTM Squeeze suite. While Wave A reveals the heartbeat of momentum, Wave B focuses on the directional stability of price. It answers a critical question for traders: Is the trend in my favor, or am I trading against the dominant force?
Built for confirming entries and filtering out low-probability setups, Kyber Cell’s Wave B applies a smoother, more deliberate view of trend structure using configurable moving average logic. This makes it ideal for preventing false starts and improving trade alignment — particularly in combination with Wave A and squeeze-fire signals.
⸻
2. Core Concept and Calculation
Unlike Wave A, which tracks short-term price bursts, Wave B focuses on trend direction and consistency. It typically derives its signal from one of two engines:
• EMA-Based Method: Compares short-term EMA (e.g., 8) to a longer EMA (e.g., 21) to determine directional bias.
• HMA-Based Method: Measures slope and crossover behavior between fast and slow Hull Moving Averages (e.g., HMA 34 and HMA 144) for a smoother trend read.
These calculations produce a histogram that doesn’t fluctuate rapidly like Wave A, but instead stabilizes around sustained trend strength. As such, Wave B excels at confirming whether a move has backing from the broader market structure.
⸻
3. Visual Output and Color Logic
Wave B uses a 3-color histogram to clearly define trend state:
• Bright Blue: Bullish trend
• Bright Red: Bearish trend
• Gray: Neutral or transitioning state (indecision)
This simplified color scheme helps traders avoid information overload and focus on whether the market is structurally aligned for long or short entries.
• When paired with a squeeze-fire and rising Wave A, a blue Wave B bar signals strong confirmation to go long.
• Conversely, a red Wave B bar during a squeeze-fire and falling Wave A confirms bearish setups.
• A gray bar typically signals trend conflict, indecision, or transitional environments — and should be treated as a caution flag.
⸻
4. Ideal Use Case
Wave B is best used as a filter and confirmation layer in your trading workflow:
1. Identify a squeeze setup (using Squeeze Pro or dots indicator).
2. Confirm with Wave A: Look for a fresh momentum push (cyan or red bars).
3. Validate with Wave B:
• Only take long trades when Wave B is blue.
• Only take short trades when Wave B is red.
• Avoid or delay trades when Wave B is gray.
4. Ride the trend until Wave B flips or Wave A fades.
This reduces emotional decision-making and keeps your trades aligned with the prevailing bias, especially on higher timeframes or in choppy conditions.
⸻
5. Configuration and Customization
Wave B is designed with enough flexibility to adapt to different trading styles while remaining streamlined:
• Trend Engine Selection: Choose between EMA-based or HMA-based logic.
• Moving Average Lengths: Customize the short- and long-term periods.
• Color Customization: Adjust bar colors to match your chart theme or visibility needs.
• Bar Thickness and Positioning: Optional visual tweaks depending on your chart layout.
The goal is to provide just enough configurability to integrate seamlessly with Wave A and Squeeze Pro, without diluting the core purpose: trend clarity.
⸻
6. Alerts and Add-ons
Wave B can be extended with basic or advanced alerts, depending on your needs:
• Alert on trend flips (blue → red or red → blue)
• Alert on return to neutral (gray bars)
• Combined alerts with squeeze and momentum signals for high-confluence trades
When integrated with other components, Wave B becomes an essential part of a multi-layered confirmation system.
⸻
7. Disclaimer
This indicator is provided for educational purposes only and is not financial advice. No trading decision should be made solely on the basis of this tool. All users should test their strategies, assess their own risk tolerance, and consider using Wave B as part of a broader technical framework.
Açık kaynak kodlu komut dosyası
Gerçek TradingView ruhuyla, bu komut dosyasının yaratıcısı, yatırımcıların işlevselliğini inceleyip doğrulayabilmesi için onu açık kaynaklı hale getirdi. Yazarı tebrik ederiz! Ücretsiz olarak kullanabilseniz de, kodu yeniden yayınlamanın Topluluk Kurallarımıza tabi olduğunu unutmayın.
Feragatname
Bilgiler ve yayınlar, TradingView tarafından sağlanan veya onaylanan finansal, yatırım, alım satım veya diğer türden tavsiye veya öneriler anlamına gelmez ve teşkil etmez. Kullanım Koşulları bölümünde daha fazlasını okuyun.