OPEN-SOURCE SCRIPT
Triple Moving Averages
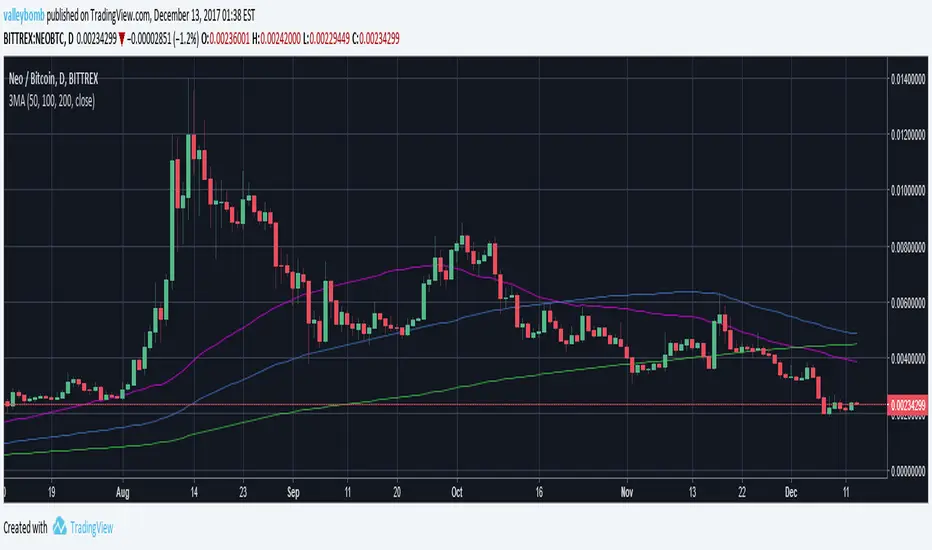
Very basic, just allows for 3 different moving averages in one indicator. Set the defaults to 50, 100 and 200 day, but numbers and colors can be adjusted to taste. Mashed this together from what I found online for a few people who were interested in having this in a community I belong to. Shout out to the Data Dash community!
Açık kaynak kodlu komut dosyası
Gerçek TradingView ruhuna uygun olarak, bu komut dosyasının oluşturucusu bunu açık kaynaklı hale getirmiştir, böylece yatırımcılar betiğin işlevselliğini inceleyip doğrulayabilir. Yazara saygı! Ücretsiz olarak kullanabilirsiniz, ancak kodu yeniden yayınlamanın Site Kurallarımıza tabi olduğunu unutmayın.
Feragatname
Bilgiler ve yayınlar, TradingView tarafından sağlanan veya onaylanan finansal, yatırım, işlem veya diğer türden tavsiye veya tavsiyeler anlamına gelmez ve teşkil etmez. Kullanım Şartları'nda daha fazlasını okuyun.