PINE LIBRARY
Güncellendi lib_profile
Library "lib_profile"
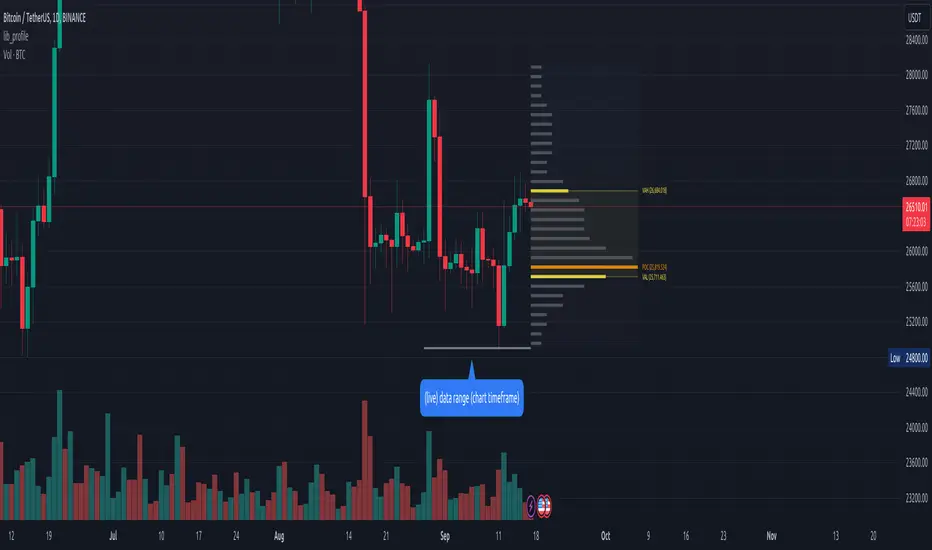
a library with functions to calculate a volume profile for either a set of candles within the current chart, or a single candle from its lower timeframe security data. All you need is to feed the
method delete(this)
deletes this bucket's plot from the chart
Namespace types: Bucket
Parameters:
this (Bucket)
method delete(this)
Namespace types: Profile
Parameters:
this (Profile)
method delete(this)
Namespace types: Bucket[]
Parameters:
this (Bucket[])
method delete(this)
Namespace types: Profile[]
Parameters:
this (Profile[])
method update(this, top, bottom, value, fraction)
updates this bucket's data
Namespace types: Bucket
Parameters:
this (Bucket)
top (float)
bottom (float)
value (float)
fraction (float)
method update(this, tops, bottoms, values)
update this Profile's data (recalculates the whole profile and applies the result to this object) TODO optimisation to calculate this incremental to improve performance in realtime on high resolution
Namespace types: Profile
Parameters:
this (Profile)
tops (float[]): array of range top/high values (either from ltf or chart candles using history() function
bottoms (float[]): array of range bottom/low values (either from ltf or chart candles using history() function
values (float[]): array of range volume/1 values (either from ltf or chart candles using history() function (1s can be used for analysing candles in bucket/price range over time)
method tostring(this)
allows debug print of a bucket
Namespace types: Bucket
Parameters:
this (Bucket)
method draw(this, start_t, start_i, end_t, end_i, args, line_color)
allows drawing a line in a Profile, representing this bucket and it's value + it's value's fraction of the Profile total value
Namespace types: Bucket
Parameters:
this (Bucket)
start_t (int): the time x coordinate of the line's left end (depends on the Profile box)
start_i (int): the bar_index x coordinate of the line's left end (depends on the Profile box)
end_t (int): the time x coordinate of the line's right end (depends on the Profile box)
end_i (int): the bar_index x coordinate of the line's right end (depends on the Profile box)
args (LineArgs type from robbatt/lib_plot_objects/24): the default arguments for the line style
line_color (color): the color override for POC/VAH/VAL lines
method draw(this, forced_width)
draw all components of this Profile (Box, Background, Bucket lines, POC/VAH/VAL overlay levels and labels)
Namespace types: Profile
Parameters:
this (Profile)
forced_width (int): allows to force width of the Profile Box, overrides the ProfileArgs.default_size and ProfileArgs.extend arguments (default: na)
method init(this)
Namespace types: ProfileArgs
Parameters:
this (ProfileArgs)
method init(this)
Namespace types: Profile
Parameters:
this (Profile)
profile(tops, bottoms, values, resolution, vah_pc, val_pc, bucket_buffer)
split a chart/parent bar into 'resolution' sections, figure out in which section the most volume/time was spent, by analysing a given set of (intra)bars' top/bottom/volume values. Then return price center of the bin with the highest volume, essentially marking the point of control / highest volume (poc) in the chart/parent bar.
Parameters:
tops (float[]): array of range top/high values (either from ltf or chart candles using history() function
bottoms (float[]): array of range bottom/low values (either from ltf or chart candles using history() function
values (float[]): array of range volume/1 values (either from ltf or chart candles using history() function (1s can be used for analysing candles in bucket/price range over time)
resolution (int): amount of buckets/price ranges to sort the candle data into (analyse how much volume / time was spent in a certain bucket/price range) (default: 25)
vah_pc (float): a threshold percentage (of values' total) for the top end of the value area (default: 80)
val_pc (float): a threshold percentage (of values' total) for the bottom end of the value area (default: 20)
bucket_buffer (Bucket[]): optional buffer of empty Buckets to fill, if omitted a new one is created and returned. The buffer length must match the resolution
Returns: poc (price level), vah (price level), val (price level), poc_index (idx in buckets), vah_index (idx in buckets), val_index (idx in buckets), buckets (filled buffer or new)
create_profile(start_idx, tops, bottoms, values, resolution, vah_pc, val_pc, args)
split a chart/parent bar into 'resolution' sections, figure out in which section the most volume/time was spent, by analysing a given set of (intra)bars' top/bottom/volume values. Then return price center of the bin with the highest volume, essentially marking the point of control / highest volume (poc) in the chart/parent bar.
Parameters:
start_idx (int): the bar_index at which the Profile should start drawing
tops (float[]): array of range top/high values (either from ltf or chart candles using history() function
bottoms (float[]): array of range bottom/low values (either from ltf or chart candles using history() function
values (float[]): array of range volume/1 values (either from ltf or chart candles using history() function (1s can be used for analysing candles in bucket/price range over time)
resolution (int): amount of buckets/price ranges to sort the candle data into (analyse how much volume / time was spent in a certain bucket/price range) (default: 25)
vah_pc (float): a threshold percentage (of values' total) for the top end of the value area (default: 80)
val_pc (float): a threshold percentage (of values' total) for the bottom end of the value area (default: 20)
args (ProfileArgs)
Returns: poc (price level), vah (price level), val (price level), poc_index (idx in buckets), vah_index (idx in buckets), val_index (idx in buckets), buckets (filled buffer or new)
history(src, len, offset)
allows fetching an array of values from the history series with offset from current candle
Parameters:
src (int)
len (int)
offset (int)
history(src, len, offset)
allows fetching an array of values from the history series with offset from current candle
Parameters:
src (float)
len (int)
offset (int)
history(src, len, offset)
allows fetching an array of values from the history series with offset from current candle
Parameters:
src (bool)
len (int)
offset (int)
history(src, len, offset)
allows fetching an array of values from the history series with offset from current candle
Parameters:
src (string)
len (int)
offset (int)
Bucket
Fields:
idx (series int): the index of this Bucket within the Profile starting with 0 for the lowest Bucket at the bottom of the Profile
value (series float): the value of this Bucket, can be volume or time, for using time pass and array of 1s to the update function
top (series float): the top of this Bucket's price range (for calculation)
btm (series float): the bottom of this Bucket's price range (for calculation)
center (series float): the center of this Bucket's price range (for plotting)
fraction (series float): the fraction this Bucket's value is compared to the total of the Profile
plot_bucket_line (Line type from robbatt/lib_plot_objects/24): the line that resembles this bucket and it's valeu in the Profile
ProfileArgs
Fields:
show_poc (series bool): whether to plot a POC line across the Profile Box (default: true)
show_profile (series bool): whether to plot a line for each Bucket in the Profile Box, indicating the value per Bucket (Price range), e.g. volume that occured in a certain time and price range (default: false)
show_va (series bool): whether to plot a VAH/VAL line across the Profile Box (default: false)
show_va_fill (series bool): whether to fill the 'value' area between VAH/VAL line (default: false)
show_background (series bool): whether to fill the Profile Box with a background color (default: false)
show_labels (series bool): whether to add labels to the right end of the POC/VAH/VAL line (default: false)
show_price_levels (series bool): whether add price values to the labels to the right end of the POC/VAH/VAL line (default: false)
extend (series bool): whether extend the Profile Box to the current candle (default: false)
default_size (series int): the default min. width of the Profile Box (default: 30)
args_poc_line (LineArgs type from robbatt/lib_plot_objects/24): arguments for the poc line plot
args_va_line (LineArgs type from robbatt/lib_plot_objects/24): arguments for the va line plot
args_poc_label (LabelArgs type from robbatt/lib_plot_objects/24): arguments for the poc label plot
args_va_label (LabelArgs type from robbatt/lib_plot_objects/24): arguments for the va label plot
args_profile_line (LineArgs type from robbatt/lib_plot_objects/24): arguments for the Bucket line plots
args_profile_bg (BoxArgs type from robbatt/lib_plot_objects/24)
va_fill_color (series color): color for the va area fill plot
Profile
Fields:
start (series int): left x coordinate for the Profile Box
end (series int): right x coordinate for the Profile Box
resolution (series int): the amount of buckets/price ranges the Profile will dissect the data into
vah_threshold_pc (series float): the percentage of the total data value to mark the upper threshold for the main value area
val_threshold_pc (series float): the percentage of the total data value to mark the lower threshold for the main value area
args (ProfileArgs): the style arguments for the Profile Box
h (series float): the highest price of the data
l (series float): the lowest price of the data
total (series float): the total data value (e.g. volume of all candles, or just one each to analyse candle distribution over time)
buckets (Bucket[]): the Bucket objects holding the data for each price range bucket
poc_bucket_index (series int): the Bucket index in buckets, that holds the poc Bucket
vah_bucket_index (series int): the Bucket index in buckets, that holds the vah Bucket
val_bucket_index (series int): the Bucket index in buckets, that holds the val Bucket
poc (series float): the according price level marking the Point Of Control
vah (series float): the according price level marking the Value Area High
val (series float): the according price level marking the Value Area Low
plot_poc (Line type from robbatt/lib_plot_objects/24)
plot_vah (Line type from robbatt/lib_plot_objects/24)
plot_val (Line type from robbatt/lib_plot_objects/24)
plot_poc_label (Label type from robbatt/lib_plot_objects/24)
plot_vah_label (Label type from robbatt/lib_plot_objects/24)
plot_val_label (Label type from robbatt/lib_plot_objects/24)
plot_va_fill (LineFill type from robbatt/lib_plot_objects/24)
plot_profile_bg (Box type from robbatt/lib_plot_objects/24)
Sürüm Notları
v2 export get_ltf function to get reasonable timeframe for request.security_lower_tfSürüm Notları
v3Added:
method apply_style(this, args)
Namespace types: Profile
Parameters:
this (Profile)
args (ProfileArgs)
Sürüm Notları
v4Sürüm Notları
v5 fixed max_bars_back error on continuous drawing during replay modeUpdated:
Bucket
Fields:
idx (series int): the index of this Bucket within the Profile starting with 0 for the lowest Bucket at the bottom of the Profile
value (series float): the value of this Bucket, can be volume or time, for using time pass and array of 1s to the update function
top (series float): the top of this Bucket's price range (for calculation)
btm (series float): the bottom of this Bucket's price range (for calculation)
center (series float): the center of this Bucket's price range (for plotting)
fraction (series float): the fraction this Bucket's value is compared to the total of the Profile
plot_bucket_line (Line type from robbatt/lib_plot_objects/25): the line that resembles this bucket and it's valeu in the Profile
ProfileArgs
Fields:
show_poc (series bool): whether to plot a POC line across the Profile Box (default: true)
show_profile (series bool): whether to plot a line for each Bucket in the Profile Box, indicating the value per Bucket (Price range), e.g. volume that occured in a certain time and price range (default: false)
show_va (series bool): whether to plot a VAH/VAL line across the Profile Box (default: false)
show_va_fill (series bool): whether to fill the 'value' area between VAH/VAL line (default: false)
show_background (series bool): whether to fill the Profile Box with a background color (default: false)
show_labels (series bool): whether to add labels to the right end of the POC/VAH/VAL line (default: false)
show_price_levels (series bool): whether add price values to the labels to the right end of the POC/VAH/VAL line (default: false)
extend (series bool): whether extend the Profile Box to the current candle (default: false)
default_size (series int): the default min. width of the Profile Box (default: 30)
args_poc_line (LineArgs type from robbatt/lib_plot_objects/25): arguments for the poc line plot
args_va_line (LineArgs type from robbatt/lib_plot_objects/25): arguments for the va line plot
args_poc_label (LabelArgs type from robbatt/lib_plot_objects/25): arguments for the poc label plot
args_va_label (LabelArgs type from robbatt/lib_plot_objects/25): arguments for the va label plot
args_profile_line (LineArgs type from robbatt/lib_plot_objects/25): arguments for the Bucket line plots
args_profile_bg (BoxArgs type from robbatt/lib_plot_objects/25)
va_fill_color (series color): color for the va area fill plot
Profile
Fields:
start (series int): left x coordinate for the Profile Box
end (series int): right x coordinate for the Profile Box
resolution (series int): the amount of buckets/price ranges the Profile will dissect the data into
vah_threshold_pc (series float): the percentage of the total data value to mark the upper threshold for the main value area
val_threshold_pc (series float): the percentage of the total data value to mark the lower threshold for the main value area
args (ProfileArgs): the style arguments for the Profile Box
h (series float): the highest price of the data
l (series float): the lowest price of the data
total (series float): the total data value (e.g. volume of all candles, or just one each to analyse candle distribution over time)
buckets (Bucket[]): the Bucket objects holding the data for each price range bucket
poc_bucket_index (series int): the Bucket index in buckets, that holds the poc Bucket
vah_bucket_index (series int): the Bucket index in buckets, that holds the vah Bucket
val_bucket_index (series int): the Bucket index in buckets, that holds the val Bucket
poc (series float): the according price level marking the Point Of Control
vah (series float): the according price level marking the Value Area High
val (series float): the according price level marking the Value Area Low
plot_poc (Line type from robbatt/lib_plot_objects/25)
plot_vah (Line type from robbatt/lib_plot_objects/25)
plot_val (Line type from robbatt/lib_plot_objects/25)
plot_poc_label (Label type from robbatt/lib_plot_objects/25)
plot_vah_label (Label type from robbatt/lib_plot_objects/25)
plot_val_label (Label type from robbatt/lib_plot_objects/25)
plot_va_fill (LineFill type from robbatt/lib_plot_objects/25)
plot_profile_bg (Box type from robbatt/lib_plot_objects/25)
Sürüm Notları
v6 changed default coordinates to time basedSürüm Notları
v7 updated to lib_plot_objects v32, replaced Points with builtin chart.point objectsSürüm Notları
v8, version bump lib_plot_objects v34Added:
method hide(this)
hides this Bucket's plot from the chart by setting the line end to na
Namespace types: Bucket
Parameters:
this (Bucket)
method hide(this)
hides this Profile's plot from the chart by setting the line end to na
Namespace types: Profile
Parameters:
this (Profile)
Sürüm Notları
v9 default to bar_time for use in higher level libSürüm Notları
v10 added switch for the timeframe selection, so non-premium users can also use the lib below 1h timeframeUpdated:
get_ltf(allow_seconds)
Parameters:
allow_seconds (simple bool): if true this will use second based timeframes for the volume data (only for premium users)
Sürüm Notları
v11 version bump to lib_plot_objects v36Sürüm Notları
v12 refactored history methods, so use case 4 (profile of chart candle range) is easier to controlUpdated:
history(src, amount, offset, max_buffer_len)
allows fetching an array of values from the history series with offset from current candle
Parameters:
src (string)
amount (int)
offset (int)
max_buffer_len (simple int)
Sürüm Notları
v13 added parameter to use / disable extend_only functionality of lib_plot_objectsUpdated:
method draw(this, forced_width, extend_only)
draw all components of this Profile (Box, Background, Bucket lines, POC/VAH/VAL overlay levels and labels)
Namespace types: Profile
Parameters:
this (Profile)
forced_width (int): allows to force width of the Profile Box, overrides the ProfileArgs.default_size and ProfileArgs.extend arguments (default: na)
extend_only (bool): if false will redraw left coordinates of profile, use in combination with profile.update if same instance is reused.
Sürüm Notları
v14 made buffer length dynamic, so reduce memory consumption during multi parameter profiling.Updated:
history(src, amount, offset, max_buffer_len)
allows fetching an array of values from the history series with offset from current candle
Parameters:
src (string)
amount (int)
offset (int)
max_buffer_len (int)
Sürüm Notları
v15 default to dynamic buffer sizingSürüm Notları
v16 added use cases for weekly profile, added capture_when and reset flags to history capture functionUpdated:
history(src, amount, offset, max_buffer_len, capture_when, reset)
allows fetching an array of values from the history series with offset from current candle
Parameters:
src (string)
amount (int)
offset (int)
max_buffer_len (int)
capture_when (bool)
reset (bool)
Sürüm Notları
v17 updated to allow offset and custom labels for profile plottingSürüm Notları
v18 as per request splitted coloring options for VAH and VAL lines and labels so they can be assigned different colors.Sürüm Notları
v20 added possibility to lazily update a profile, procedure to get a profile from a bar in the past, is to call create_profile on every bar, store it in a buffer array, then call update on the profile only when calculation of values is needed.Sürüm Notları
v21 - performance improvement through selective drawing, added detail level for get_ltf to control how many bars are fetched/processed from lower timeframe. Changed initialization process: use Profile.new(...sources...).update() for single use, or multiple update(..sources...) for continous/developing/live profiles.Updated:
method update(this, tops, bottoms, values, end)
update this Profile's data (recalculates the whole profile and applies the result to this object)
Namespace types: Profile
Parameters:
this (Profile)
tops (array<float>): array of range top/high values (either from ltf or chart candles using history() function
bottoms (array<float>): array of range bottom/low values (either from ltf or chart candles using history() function
values (array<float>): array of range volume/1 values (either from ltf or chart candles using history() function (1s can be used for analysing candles in bucket/price range over time)
end (int)
get_ltf(detail_lvl, allow_seconds)
Parameters:
detail_lvl (simple int): select a value between 0-4 to decrease the returned LTF. This will lead to improved detail of generated profiles, but also require significant more computing power and slow down your script. (default: 1)
allow_seconds (simple bool): if true this will use second based timeframes. This will significantly increase detail and script runtime in <=1h timeframes (only for premium users)
Profile
Fields:
start (series int): left x coordinate for the Profile Box
end (series int): right x coordinate for the Profile Box
resolution (series int): the amount of buckets/price ranges the Profile will dissect the data into
vah_threshold_pc (series float): the percentage of the total data value to mark the upper threshold for the main value area
val_threshold_pc (series float): the percentage of the total data value to mark the lower threshold for the main value area
data_tops (array<float>): array of range top/high values (either from ltf or chart candles using history() function
data_bottoms (array<float>): array of range bottom/low values (either from ltf or chart candles using history() function
data_values (array<float>): array of range volume/1 values (either from ltf or chart candles using history() function (1s can be used for analysing candles in bucket/price range over time)
args (ProfileArgs): the style arguments for the Profile Box
h (series float): the highest price of the data | filled by update()
l (series float): the lowest price of the data | filled by update()
total (series float): the total data value (e.g. volume of all candles, or just one each to analyse candle distribution over time) | filled by update()
buckets (array<Bucket>): the Bucket objects holding the data for each price range bucket | filled by update()
poc_bucket_index (series int): the Bucket index in buckets, that holds the poc Bucket | filled by update()
vah_bucket_index (series int): the Bucket index in buckets, that holds the vah Bucket | filled by update()
val_bucket_index (series int): the Bucket index in buckets, that holds the val Bucket | filled by update()
poc (series float): the according price level marking the Point Of Control | filled by update()
vah (series float): the according price level marking the Value Area High | filled by update()
val (series float): the according price level marking the Value Area Low | filled by update()
plot_poc (Line type from robbatt/lib_plot_objects/36): | filled by draw()
plot_vah (Line type from robbatt/lib_plot_objects/36): | filled by draw()
plot_val (Line type from robbatt/lib_plot_objects/36): | filled by draw()
plot_poc_label (Label type from robbatt/lib_plot_objects/36): | filled by draw()
plot_vah_label (Label type from robbatt/lib_plot_objects/36): | filled by draw()
plot_val_label (Label type from robbatt/lib_plot_objects/36): | filled by draw()
plot_va_fill (LineFill type from robbatt/lib_plot_objects/36): | filled by draw()
plot_profile_bg (Box type from robbatt/lib_plot_objects/36): | filled by draw()
Removed:
create_profile(start_idx, tops, bottoms, values, resolution, vah_pc, val_pc, args)
split a chart/parent bar into 'resolution' sections, figure out in which section the most volume/time was spent, by analysing a given set of (intra)bars' top/bottom/volume values. Then return price center of the bin with the highest volume, essentially marking the point of control / highest volume (poc) in the chart/parent bar.
Sürüm Notları
v22- added intrabar update capabilities (via varip)
- now setting plot members to na inside delete() (to allow reuse of Profile instance/data)
- refactored Profile.init() to allow for reinit (of buckets) after profile height changed
- create_profile factory method now initializes plot member by default, so it will not be na after rollback between ticks and on update just (bucket/line/label) coordinates have to be set
- added lazy drawing capabilities from updated lib_plot_objects
- added deep_copy functions to clone lazy drawn Profiles
- updated examples
- added index (idx) field for Profile for easier debugging / identification
- added force_overlay capabilities
Added:
create_profile(start, end, tops, bottoms, values, args, resolution, vah_pc, val_pc, init_plot, force_overlay)
Parameters:
start (int)
end (int)
tops (array<float>)
bottoms (array<float>)
values (array<float>)
args (ProfileArgs)
resolution (int)
vah_pc (float)
val_pc (float)
init_plot (bool)
force_overlay (bool)
method deep_copy(this)
Namespace types: Profile
Parameters:
this (Profile)
Updated:
method draw(this, forced_width, extend_only, force_overlay)
draw all components of this Profile (Box, Background, Bucket lines, POC/VAH/VAL overlay levels and labels)
Namespace types: Profile
Parameters:
this (Profile)
forced_width (int): allows to force width of the Profile Box, overrides the ProfileArgs.default_size and ProfileArgs.extend arguments (default: na)
extend_only (bool)
force_overlay (bool)
Removed:
method tostring(this)
allows debug print of a bucket
Sürüm Notları
v23 - exported calculate function to allow initialization with delayed/lazy calculation
- added init_calculated parameter (default: true) to create_profile, so Profile is created with POC/VAH/VAL already defined and can be chained with a .draw() call.
- removed duplicate profile() function, use create_profile().calculate() instead
Added:
method calculate(this)
recalculates this Profile's data (update() will only recalculate if new data is passed, this one forces recalculation)
Namespace types: Profile
Parameters:
this (Profile)
Updated:
create_profile(start, end, tops, bottoms, values, args, resolution, vah_pc, val_pc, init_calculated, init_plot, force_overlay, idx)
creates a new Profile
Parameters:
start (int): index from where to draw the Profile (left edge)
end (int): index until where to draw the Profile (right edge)
tops (array<float>): data for profiled range's highs
bottoms (array<float>): data for profiled range's lows
values (array<float>): data for profiled range's value data (volume/time)
args (ProfileArgs): style args for this Profile
resolution (int): amount of buckets in which to split the analysis (default: 25)
vah_pc (float): Value Area High percentage (default: 80)
val_pc (float): Value Area Low percentage (default: 20)
init_calculated (bool): whether to run an initial calculation on creation (POC, VAH, VAL). Set this to false if you want to have a lightweight initialization process and only calculate at a certain event (default: true)
init_plot (bool): whether to initialize the chart plot objects (not drawing the full profile yet, just creating placeholders that can be quickly filled with data!). Run .draw() after this to actually draw the Profile to the chart. (default: false)
force_overlay (bool): if this is a non overlay indicator in a separate pane, use force_overlay to draw the Profile into the chart (default: false)
idx (int): gives this Profile an index value to allow for easier identification in debugging/logs (default: bar_index)
Removed:
profile(tops, bottoms, values, resolution, vah_pc, val_pc, bucket_buffer)
split a chart/parent bar into 'resolution' sections, figure out in which section the most volume/time was spent, by analysing a given set of (intra)bars' top/bottom/volume values. Then return price center of the bin with the highest volume, essentially marking the point of control / highest volume (poc) in the chart/parent bar.
Sürüm Notları
added workaround for compilation error introduced on 24.10.2024Sürüm Notları
v25- added convenience reset function for reuse of Profile objects after deep_copy
- refined update and create_profile methods to include separate time and index coordinate parameters for start and end of profile
- refactored draw method accordingly to use index and time parameters instead of calculating everything (at times wrong when there were gaps in some stocks)
- draw behavior of profiles changed to draw from start to end (given parameters at instantiation) -> optional override with draw_from_t/i parameters -> optional override with forced_width -> optional override with ProfileArgs.extend to extend profile to current bar -> optional override with ProfileArgs.default_size (same as forcedWidth, but usable as shared default setting via ProfileArgs)
- adapted use case examples
Added:
method reset(this)
Namespace types: Profile
Parameters:
this (Profile)
Updated:
method update(this, tops, bottoms, values, end_t, end_i)
update this Profile's data (recalculates the whole profile and applies the result to this object)
Namespace types: Profile
Parameters:
this (Profile)
tops (array<float>): array of range top/high values (either from ltf or chart candles using history() function
bottoms (array<float>): array of range bottom/low values (either from ltf or chart candles using history() function
values (array<float>): array of range volume/1 values (either from ltf or chart candles using history() function (1s can be used for analysing candles in bucket/price range over time)
end_t (int)
end_i (int)
create_profile(start_t, start_i, end_t, end_i, tops, bottoms, values, args, resolution, vah_pc, val_pc, init_calculated, init_plot, force_overlay, idx)
creates a new Profile
Parameters:
start_t (int)
start_i (int)
end_t (int)
end_i (int)
tops (array<float>): data for profiled range's highs
bottoms (array<float>): data for profiled range's lows
values (array<float>): data for profiled range's value data (volume/time)
args (ProfileArgs): style args for this Profile
resolution (int): amount of buckets in which to split the analysis (default: 25)
vah_pc (float): Value Area High percentage (default: 80)
val_pc (float): Value Area Low percentage (default: 20)
init_calculated (bool): whether to run an initial calculation on creation (POC, VAH, VAL). Set this to false if you want to have a lightweight initialization process and only calculate at a certain event (default: true)
init_plot (bool): whether to initialize the chart plot objects (not drawing the full profile yet, just creating placeholders that can be quickly filled with data!). Run .draw() after this to actually draw the Profile to the chart. (default: false)
force_overlay (bool): if this is a non overlay indicator in a separate pane, use force_overlay to draw the Profile into the chart (default: false)
idx (int): gives this Profile an index value to allow for easier identification in debugging/logs (default: bar_index)
method draw(this, draw_from_t, draw_from_i, forced_width, extend_only, force_overlay)
draw all components of this Profile (Box, Background, Bucket lines, POC/VAH/VAL overlay levels and labels). The profile is drawn from first to last bar / start to end of the profiled bars Optional drawing from another origin is possible with draw_from_t/draw_from_i (time/bar_index). Optional the width of the drawn profile can dynamically adjusted to a number of bars via forced_width (gaps in data are not considered via xloc = bar_time). Optional with ProfileArgs.extend the profile can extend to the current bar_index (usefull for POC and Value Area lines). Optional ProfileArgs.default_size can be used to configure a shared default length for profiles.
Namespace types: Profile
Parameters:
this (Profile)
draw_from_t (int): from which time to draw the profile. ProfileArgs.args.xloc decides which one is used (default: na -> using profile start coordinate)
draw_from_i (int): from which bar_index to draw the profile. ProfileArgs.args.xloc decides which one is used (default: na -> using profile start coordinate)
forced_width (int): allows to force width of the Profile Box, overrides the ProfileArgs.default_size and ProfileArgs.extend arguments (default: na -> width = amount of bars in profiled window)
extend_only (bool): unless draw_from_t/draw_from_i is used and changing, this can remain at default true and the start point x coordinates will not be updated, preventing errors when drawing based on bar_index
force_overlay (bool)
Sürüm Notları
v26- updated to pine v6
- added optional logic for considering open and close values, to be able to calculate better profiles from 1-5 candles without fetching lower timeframe data
- fixed bug in end index calculation in profile.draw()
- fixed bug for POC/VAH/VAL calculation in profile.update() for range data
- updated examples and docs
Sürüm Notları
v27 skipping open/close data consideration/calculation after exceeding max_range_to_use_open_close_data items in data_valuesSürüm Notları
v28 updated lib_plot_objects import to v46Sürüm Notları
v29 updated to lib_plot_objects v47, removed useless sample codeSürüm Notları
v30 update to lib_plot_objects v48Sürüm Notları
v31 added hidden flag to void re-hiding of already hidden objectsSürüm Notları
v32 revert to ternary operators, pine v6 shortcut evaluation still buggyUpdated:
Bucket
Fields:
idx (series int): the index of this Bucket within the Profile starting with 0 for the lowest Bucket at the bottom of the Profile
value (series float): the value of this Bucket, can be volume or time, for using time pass and array of 1s to the update function
top (series float): the top of this Bucket's price range (for calculation)
btm (series float): the bottom of this Bucket's price range (for calculation)
center (series float): the center of this Bucket's price range (for plotting)
fraction (series float): the fraction this Bucket's value is compared to the total of the Profile
plot_bucket_line (Line type from robbatt/lib_plot_objects/49): the line that resembles this bucket and it's valeu in the Profile
ProfileArgs
Fields:
show_poc (series bool): whether to plot a POC line across the Profile Box (default: true)
show_profile (series bool): whether to plot a line for each Bucket in the Profile Box, indicating the value per Bucket (Price range), e.g. volume that occured in a certain time and price range (default: false)
show_va (series bool): whether to plot a VAH/VAL line across the Profile Box (default: false)
show_va_fill (series bool): whether to fill the 'value' area between VAH/VAL line (default: false)
show_background (series bool): whether to fill the Profile Box with a background color (default: false)
show_labels (series bool): whether to add labels to the right end of the POC/VAH/VAL line (default: false)
show_price_levels (series bool): whether add price values to the labels to the right end of the POC/VAH/VAL line (default: false)
extend (series bool): whether extend the Profile Box to the current candle (default: false)
xloc (series string)
default_size (series int): the default min. width of the Profile Box (default: 30)
max_range_to_use_open_close_data (series int): the max. amount of candles in a range that qualifies for using open/close data for profile calculation (default: 4)
poc_label_text (series string)
vah_label_text (series string)
val_label_text (series string)
args_poc_line (LineArgs type from robbatt/lib_plot_objects/49): arguments for the poc line plot
args_vah_line (LineArgs type from robbatt/lib_plot_objects/49): arguments for the va line plot
args_val_line (LineArgs type from robbatt/lib_plot_objects/49): arguments for the va line plot
args_poc_label (LabelArgs type from robbatt/lib_plot_objects/49): arguments for the poc label plot
args_vah_label (LabelArgs type from robbatt/lib_plot_objects/49): arguments for the va label plot
args_val_label (LabelArgs type from robbatt/lib_plot_objects/49): arguments for the va label plot
args_profile_line (LineArgs type from robbatt/lib_plot_objects/49): arguments for the Bucket line plots
args_profile_bg (BoxArgs type from robbatt/lib_plot_objects/49)
va_fill_color (series color): color for the va area fill plot
initialized (series bool)
Profile
Fields:
id (series int)
start_t (series int)
start_i (series int)
end_t (series int)
end_i (series int)
resolution (series int): the amount of buckets/price ranges the Profile will dissect the data into
vah_threshold_pc (series float): the percentage of the total data value to mark the upper threshold for the main value area
val_threshold_pc (series float): the percentage of the total data value to mark the lower threshold for the main value area
data_opens (array<float>): (optional) array of range open values (either from ltf or chart candles using history() function
data_highs (array<float>): array of range top/high values (either from ltf or chart candles using history() function
data_lows (array<float>): array of range bottom/low values (either from ltf or chart candles using history() function
data_closes (array<float>): (optional) array of range close values (either from ltf or chart candles using history() function
data_values (array<float>): array of range volume/1 values (either from ltf or chart candles using history() function (1s can be used for analysing candles in bucket/price range over time)
args (ProfileArgs): the style arguments for the Profile Box
h (series float): the highest price of the data | filled by update()
l (series float): the lowest price of the data | filled by update()
total (series float): the total data value (e.g. volume of all candles, or just one each to analyse candle distribution over time) | filled by update()
buckets (array<Bucket>): the Bucket objects holding the data for each price range bucket | filled by update()
poc_bucket_index (series int): the Bucket index in buckets, that holds the poc Bucket | filled by update()
vah_bucket_index (series int): the Bucket index in buckets, that holds the vah Bucket | filled by update()
val_bucket_index (series int): the Bucket index in buckets, that holds the val Bucket | filled by update()
poc (series float): the according price level marking the Point Of Control | filled by update()
vah (series float): the according price level marking the Value Area High | filled by update()
val (series float): the according price level marking the Value Area Low | filled by update()
plot_poc (Line type from robbatt/lib_plot_objects/49): | filled by draw()
plot_vah (Line type from robbatt/lib_plot_objects/49): | filled by draw()
plot_val (Line type from robbatt/lib_plot_objects/49): | filled by draw()
plot_poc_label (Label type from robbatt/lib_plot_objects/49): | filled by draw()
plot_vah_label (Label type from robbatt/lib_plot_objects/49): | filled by draw()
plot_val_label (Label type from robbatt/lib_plot_objects/49): | filled by draw()
plot_va_fill (LineFill type from robbatt/lib_plot_objects/49): | filled by draw()
plot_profile_bg (Box type from robbatt/lib_plot_objects/49): | filled by draw()
hidden (series bool)
Sürüm Notları
v33 added total_up and total_down to ProfileSürüm Notları
v34 fixed bug in total_up/total_down calculationSürüm Notları
v35 fixed bug when chart has gaps in ltf dataSürüm Notları
v36 added option for absolute x end coordinate on draw()Sürüm Notları
v36 added option for absolute x end coordinate on draw()Sürüm Notları
v38 update to lib_plot_objects v50Sürüm Notları
v39 added poc label text override for draw(), Sürüm Notları
v40 fixed display bug ( application of changing profile args on draw() )Sürüm Notları
v41 implemented top down dependency injection for configs / args in draw methods across all libs, properly separated calculation and drawing, refactored examples, improved performance speed and memorySürüm Notları
v42 update to lib_plot_objects v56Sürüm Notları
v43 fixed issue with poc line not being plotted, removed override for 50% transparency of profile lines -> set it via ProfileConfig.args_poc_line.line_color insteadSürüm Notları
v44 fixed error in POC label textPine kitaplığı
Gerçek TradingView ruhuyla, yazar bu Pine kodunu açık kaynaklı bir kütüphane olarak yayınladı, böylece topluluğumuzdaki diğer Pine programcıları onu yeniden kullanabilir. Yazarı tebrik ederiz! Bu kütüphaneyi özel olarak veya diğer açık kaynaklı yayınlarda kullanabilirsiniz, ancak bu kodun yayınlarda yeniden kullanılması Topluluk Kuralları tarafından yönetilir.
Feragatname
Bilgiler ve yayınlar, TradingView tarafından sağlanan veya onaylanan finansal, yatırım, alım satım veya diğer türden tavsiye veya öneriler anlamına gelmez ve teşkil etmez. Kullanım Koşulları bölümünde daha fazlasını okuyun.
Pine kitaplığı
Gerçek TradingView ruhuyla, yazar bu Pine kodunu açık kaynaklı bir kütüphane olarak yayınladı, böylece topluluğumuzdaki diğer Pine programcıları onu yeniden kullanabilir. Yazarı tebrik ederiz! Bu kütüphaneyi özel olarak veya diğer açık kaynaklı yayınlarda kullanabilirsiniz, ancak bu kodun yayınlarda yeniden kullanılması Topluluk Kuralları tarafından yönetilir.
Feragatname
Bilgiler ve yayınlar, TradingView tarafından sağlanan veya onaylanan finansal, yatırım, alım satım veya diğer türden tavsiye veya öneriler anlamına gelmez ve teşkil etmez. Kullanım Koşulları bölümünde daha fazlasını okuyun.