PROTECTED SOURCE SCRIPT
Breakout Zones • No Repaint (Daily Levels)
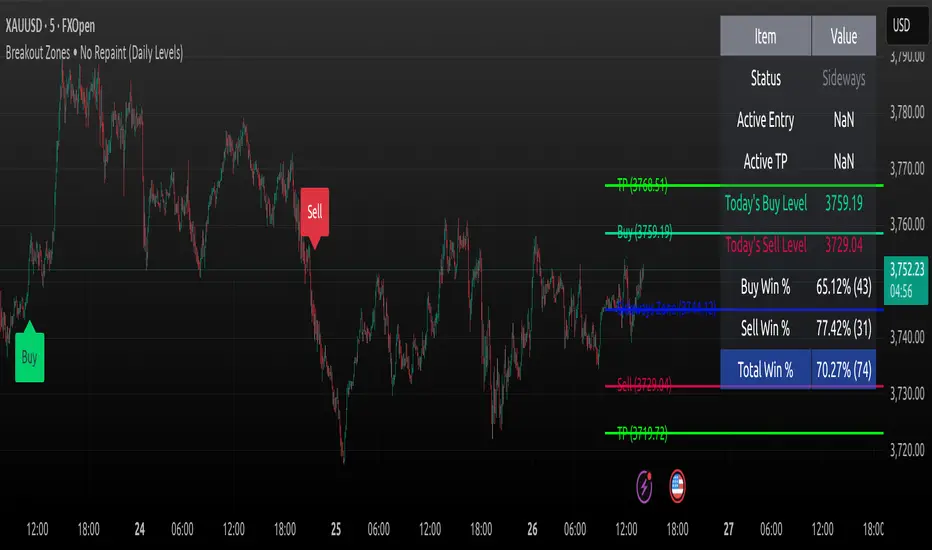
📌 Breakout Zones • No Repaint (Daily Levels)
This indicator is designed to help intraday and swing traders identify high-probability breakout levels based on the previous day’s price action. It uses pivot logic derived from the prior daily high, low, and close to generate precise Buy/Sell entries and Take Profit (TP) levels.
🧠 How It Works:
Daily Levels Calculation:
At the start of each trading day, the script calculates:
Sideways Zone = (Previous Day High + Low + Close) ÷ 3
Buy Entry (r1) = Sideways + 38.2% of yesterday’s range
Buy TP (r2) = Sideways + 61.8% of yesterday’s range
Sell Entry (s1) = Sideways – 38.2% of range
Sell TP (s2) = Sideways – 61.8% of range
Signals Generation (No Repaint):
A Buy Signal is generated when price closes above r1 (confirmed on the next candle).
A Sell Signal occurs when price closes below s1.
Signals are generated only once per day, ensuring clarity and avoiding noise.
Simulated Trade Tracking:
Each signal is tracked as a simulated trade.
If TP is hit (r2 or s2), it's counted as a win.
If TP isn't hit by the end of the day, it's a loss.
The system never repaints signals — what you see in backtest is what happened live.
Stop Loss Logic (Optional):
In strategy mode (not this script), SL can be set at the Sideways Zone (p) to manage risk.
📊 Live Trading Statistics:
A dynamic table updates in real-time, showing:
Current Trade Status (Buy Active, Sell Active, Sideways)
Today’s Entry & TP Levels
Historical Accuracy
Buy Win %
Sell Win %
Total Win %
Number of trades tracked (up to 300 lookback)
🔎 How to Use:
Add to your chart and switch to intraday timeframes like 5m, 15m, 1h.
Observe the Buy/Sell arrows and TP levels — they are confirmed signals, not repainting.
Use the accuracy table to gauge performance historically and for the current session.
Combine with volume, momentum, or trend filters for enhanced decision making.
🧩 Designed For:
Intraday scalpers looking for breakout zones
Swing traders analyzing daily structure
Users who want clean, reliable, non-repainting signals
Traders who prefer to visualize risk/reward zones automatically
🔒 About Access:
✅ This script is free to use, but source code is locked to preserve functionality, prevent tampering, and ensure clean performance for all users.
📢 Feedback Welcome!
We’re constantly improving the tool. If you find bugs, want new features, or have a use-case you'd like supported, just leave a comment.
➕ Add this indicator to your toolkit and stop chasing false breakouts.
📈 Let the chart tell you when a real opportunity forms — no repainting, no guesswork.
Korumalı komut dosyası
Bu komut dosyası kapalı kaynak olarak yayınlanmaktadır. Ancak, özgürce ve herhangi bir sınırlama olmaksızın kullanabilirsiniz – daha fazla bilgi burada.
h e
Feragatname
Bilgiler ve yayınlar, TradingView tarafından sağlanan veya onaylanan finansal, yatırım, işlem veya diğer türden tavsiye veya tavsiyeler anlamına gelmez ve teşkil etmez. Kullanım Şartları'nda daha fazlasını okuyun.
Korumalı komut dosyası
Bu komut dosyası kapalı kaynak olarak yayınlanmaktadır. Ancak, özgürce ve herhangi bir sınırlama olmaksızın kullanabilirsiniz – daha fazla bilgi burada.
Feragatname
Bilgiler ve yayınlar, TradingView tarafından sağlanan veya onaylanan finansal, yatırım, işlem veya diğer türden tavsiye veya tavsiyeler anlamına gelmez ve teşkil etmez. Kullanım Şartları'nda daha fazlasını okuyun.