OPEN-SOURCE SCRIPT
HTF Candle Support & Resistance «NoaTrader»
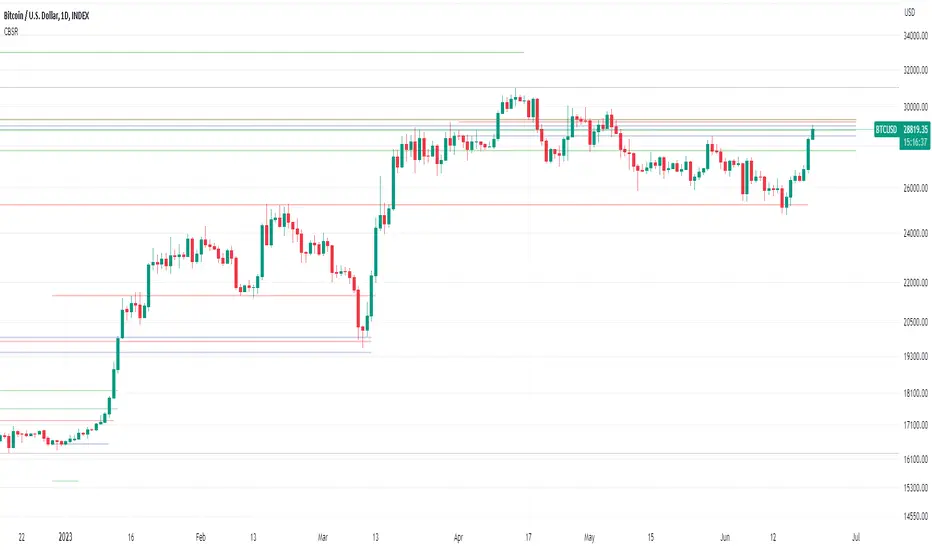
This script uses higher timeframe candle's High, Low & Close as a source for drawing a line representing potential Supports and Resistances.
The more lines you see on a level, probably the more important that level is.
The script has a single input for setting the source candle's timeframe, so it can be used on any timeframe with the proper settings. For example, higher timeframes like weekly and monthly can use "3M" or "12M" settings, Daily timeframes with "W", or even lower timeframes like minutes and seconds with "240" and "60" (M means monthly candle, W is weekly, and numbers are for minutes.)
As you can see on the code:
Give it a try on different timeframes with different settings to see interesting gaps between lines!
The more lines you see on a level, probably the more important that level is.
The script has a single input for setting the source candle's timeframe, so it can be used on any timeframe with the proper settings. For example, higher timeframes like weekly and monthly can use "3M" or "12M" settings, Daily timeframes with "W", or even lower timeframes like minutes and seconds with "240" and "60" (M means monthly candle, W is weekly, and numbers are for minutes.)
As you can see on the code:
- Red lines represent candle's High.
- Green lines represent candle's Low.
- Blue lines represent candle's Close.
Give it a try on different timeframes with different settings to see interesting gaps between lines!
Açık kaynak kodlu komut dosyası
Gerçek TradingView ruhuyla, bu komut dosyasının mimarı, yatırımcıların işlevselliğini inceleyip doğrulayabilmesi için onu açık kaynaklı hale getirdi. Yazarı tebrik ederiz! Ücretsiz olarak kullanabilseniz de, kodu yeniden yayınlamanın Topluluk Kurallarımıza tabi olduğunu unutmayın.
Feragatname
Bilgiler ve yayınlar, TradingView tarafından sağlanan veya onaylanan finansal, yatırım, alım satım veya diğer türden tavsiye veya öneriler anlamına gelmez ve teşkil etmez. Kullanım Koşulları bölümünde daha fazlasını okuyun.