OPEN-SOURCE SCRIPT
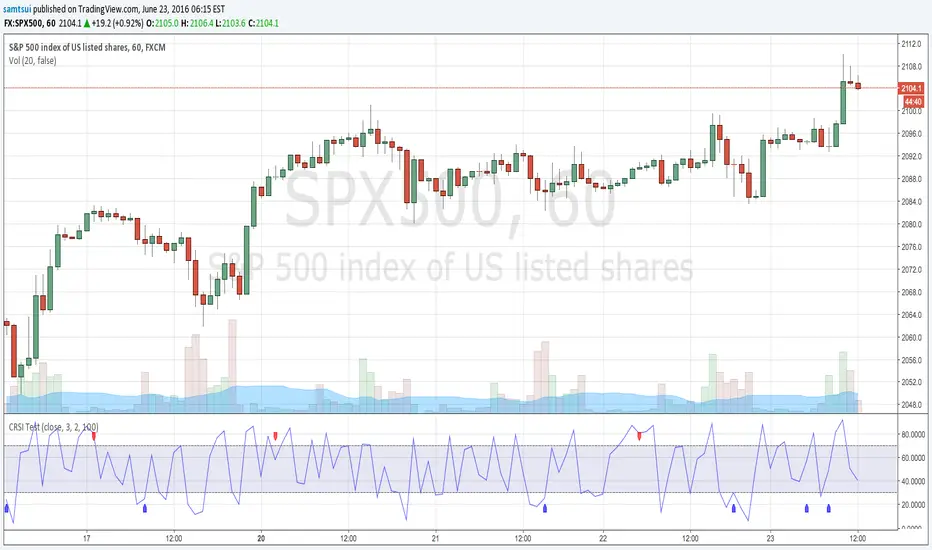
Connors RSI Test
Re Fade2Black request:
The indicator needs to use Connors RSI on candle stick charts.
It basically needs to give an alert if the candle stick closes even or up but the Conors RSI closes down more than 3 points.
Here's a pic showing..
tinypic.com/r/2j62z5v/9
And on the flip side I also need it to give an alert if the candle closes even or down but the conors rsi close up more than 3 points.
Like this..
tinypic.com/r/imjod4/9
I hope I've explained myself well. Let me know how much you'd charge for this.
Thanks
Açık kaynak kodlu komut dosyası
Gerçek TradingView ruhuna uygun olarak, bu komut dosyasının oluşturucusu bunu açık kaynaklı hale getirmiştir, böylece yatırımcılar betiğin işlevselliğini inceleyip doğrulayabilir. Yazara saygı! Ücretsiz olarak kullanabilirsiniz, ancak kodu yeniden yayınlamanın Site Kurallarımıza tabi olduğunu unutmayın.
Feragatname
Bilgiler ve yayınlar, TradingView tarafından sağlanan veya onaylanan finansal, yatırım, işlem veya diğer türden tavsiye veya tavsiyeler anlamına gelmez ve teşkil etmez. Kullanım Şartları'nda daha fazlasını okuyun.