EP Zenith Indicator
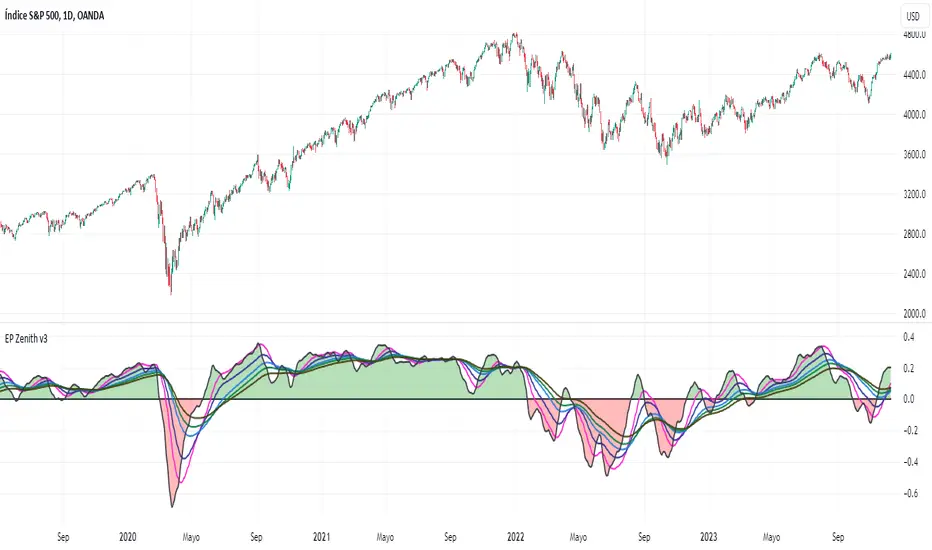
It consists of a main line, the horizontal zero line and several average lines.
We will seek purchases when:
1.- The main line rises below zero, approaches the horizontal zero, and at least the LT average (pink) is rising.
2.- The areas where the stockings tend to join from below (stocking turn)
3.- The first moments after their crossing (dispersion averages)
We will also be attentive to the differences between the price and the indicator, being these very effective in detecting trend changes.
For sales, we will take into account the same criteria, but in reverse (approximation to zero with descending averages, turning of averages, dispersion averages, divergences ...)
We will also always take into account: supports and resistances, trend lines, moving averages ...
During an uptrend (indicated by the position of the moving averages) the indicator marks the moments of correction and gives an opportunity to enter the trend.
After a sharp drop, it helps to find the best entry area, if we keep an eye on the spikes of the main line of the indicator, getting higher and higher.
If you like this indicator, send me a request for a free 30-day trial.
- Alerts have been added
TradingView alert programming is available (Add Alert-> Alert1 greater than 0)
EP Zenith is an oscillator type indicator.
Values greater than 0 show an increasing trend, while values less than 0 show a decreasing trend. The further the averages move away from the 0 line and the more time they spend above that line, the more reliable and long-term we can consider this trend.
The points to monitor are the turns of the averages, their growth or decline, as well as their order. During a bullish impulse, the averages are ordered: the fastest at the top, the slowest at the bottom. Likewise, in a fall the averages will be inverted: the fastest ones below the slow ones.
Each turn of the averages is a moment that we can consider to enter or exit a position.
A rise below the 0 line of the main average, in an area close to 0, usually indicates the beginning of an uptrend. On these occasions, the other averages tend to cross the main one or settle in an ascending position below it.
Bounces on the main average below the 0 line, especially in a generally bullish situation, indicate good entry points. In a lateral or bearish situation it is advisable to take them with caution, or to be very attentive to a new bearish turn.
In a bullish situation, crossings that occur above the 0 line can also be a good entry opportunity.
Faster average reversals indicate a price drop, especially in bearish situations.
EP Zenith sometimes reflects divergences, which can be taken into account when entering or exiting the market.
These divergences are especially useful for detecting trend endings, after a sharp drop and also after a prolonged rise.
Yalnızca davetli komut dosyası
Bu komut dosyasına yalnızca yazar tarafından onaylanan kullanıcılar erişebilir. Kullanmak için izin istemeniz ve almanız gerekir. Bu genellikle ödeme yapıldıktan sonra verilir. Daha fazla ayrıntı için aşağıdaki yazarın talimatlarını izleyin veya doğrudan EP-Trading ile iletişime geçin.
TradingView, yazarına tamamen güvenmediğiniz ve nasıl çalıştığını anlamadığınız sürece bir komut dosyası için ödeme yapmanızı veya kullanmanızı TAVSİYE ETMEZ. Ayrıca topluluk komut dosyalarımızda ücretsiz, açık kaynaklı alternatifler bulabilirsiniz.
Yazarın talimatları
Feragatname
Yalnızca davetli komut dosyası
Bu komut dosyasına yalnızca yazar tarafından onaylanan kullanıcılar erişebilir. Kullanmak için izin istemeniz ve almanız gerekir. Bu genellikle ödeme yapıldıktan sonra verilir. Daha fazla ayrıntı için aşağıdaki yazarın talimatlarını izleyin veya doğrudan EP-Trading ile iletişime geçin.
TradingView, yazarına tamamen güvenmediğiniz ve nasıl çalıştığını anlamadığınız sürece bir komut dosyası için ödeme yapmanızı veya kullanmanızı TAVSİYE ETMEZ. Ayrıca topluluk komut dosyalarımızda ücretsiz, açık kaynaklı alternatifler bulabilirsiniz.