OPEN-SOURCE SCRIPT
[MAD] Gaussian silence detector
Based on a short experiments a Gaussian silence detector
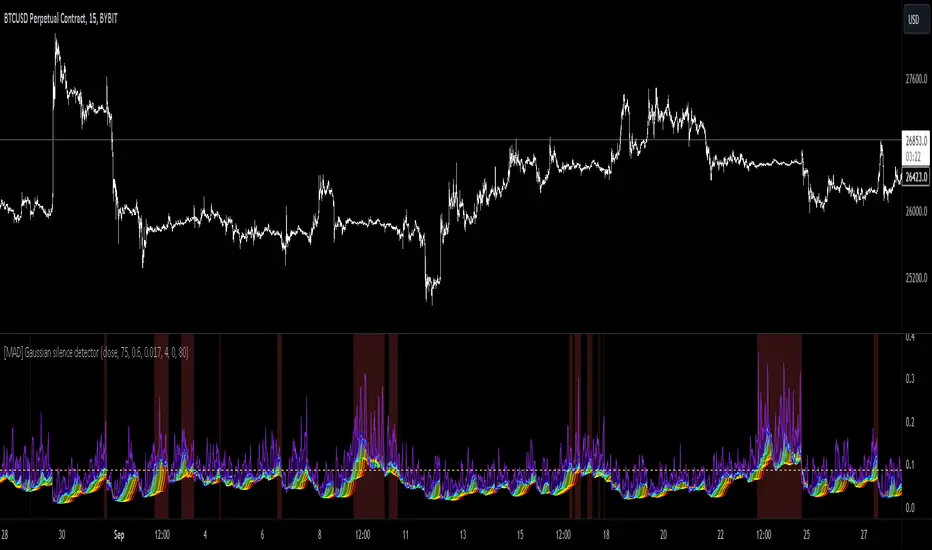
This script utilizes a Gaussian distribution function to visualize price volatility and potential major movement moments in trading.
Dynamic Spectrum Visualization:
The script plots ten different levels of the Gaussian distribution, each represented by a different color ranging from red to violet. This provides a spectrum view of the price data.
Adjustable Alert Levels:
Users can set a specific alert level, and when more than four Gaussian values exceed this threshold, a breakout alert is triggered.
Customizable Display Settings:
The visual compression, transparency, and color scheme can be adjusted to cater to different charting preferences.
Background Highlighting:
Whenever a potential breakout scenario is detected, the chart's background changes color, allowing for quick visual reference.
--------------
How to Use the Indicator
Adjust Deviation & Alert Levels:
First things first, play around with the deviation setting. This is going to help the tool understand the market's 'normal' behavior.
Next, tweak the alert levels. You want the background color to switch effectively during periods of silence. This is based on past data, so look at how the chart behaved historically and adjust accordingly.
For now each timeframe needs its own setup.
Set Up The Colors:
Once you've got the basics down, dive into the color settings. This doesn't affect how the tool works; it just makes things look prettier (or uglier, depending on your color choices 😜).
Compression (Optional):
If you think the data display is too intense or too mellow, adjust the compression. This won't change the calculations.
It's just about how you view the data.
Remember to combine it with other trading strategies and tools for the best results.
Açık kaynak kodlu komut dosyası
Gerçek TradingView ruhuna uygun olarak, bu komut dosyasının oluşturucusu bunu açık kaynaklı hale getirmiştir, böylece yatırımcılar betiğin işlevselliğini inceleyip doğrulayabilir. Yazara saygı! Ücretsiz olarak kullanabilirsiniz, ancak kodu yeniden yayınlamanın Site Kurallarımıza tabi olduğunu unutmayın.
Feragatname
Bilgiler ve yayınlar, TradingView tarafından sağlanan veya onaylanan finansal, yatırım, işlem veya diğer türden tavsiye veya tavsiyeler anlamına gelmez ve teşkil etmez. Kullanım Şartları'nda daha fazlasını okuyun.