OPEN-SOURCE SCRIPT
Keltner Zones
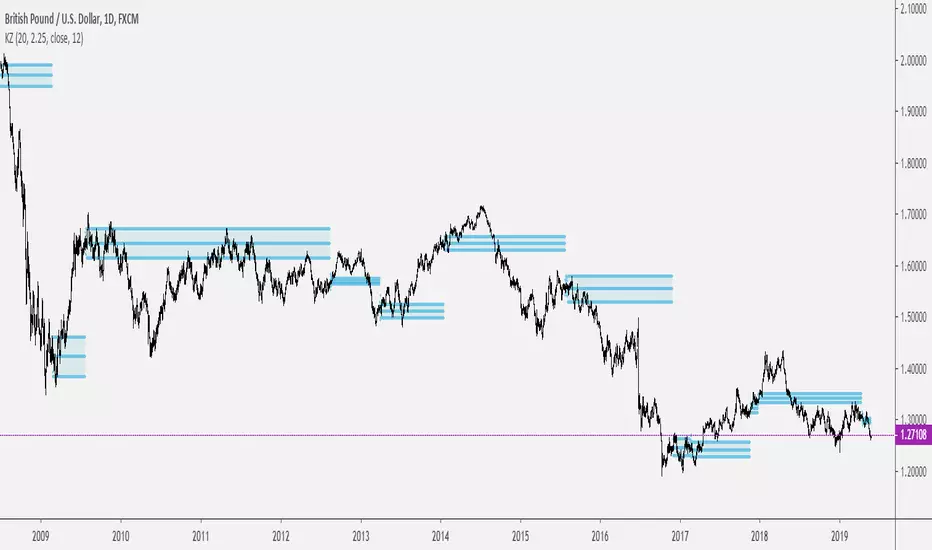
This is an indicator that draws support and resistance zones / levels based on price action in and around Keltner Channels.
There are 3 different modes;
You can also decide if you want the indicator to paint zones or levels. The Zones can grow rather large if there is a volatility shock since they are drawn using the true range around the trigger price.
Upper Band Zones

Lower Band Zones

Congestion Zone

There are 3 different modes;
- Draw zones based on price breaking the upper band
- Draw zones based on price breaking the lower band
- Draw zones if price stays within the bands for a prolonged period of time.
You can also decide if you want the indicator to paint zones or levels. The Zones can grow rather large if there is a volatility shock since they are drawn using the true range around the trigger price.
Upper Band Zones
Lower Band Zones
Congestion Zone
Açık kaynak kodlu komut dosyası
Gerçek TradingView ruhuyla, bu komut dosyasının mimarı, yatırımcıların işlevselliğini inceleyip doğrulayabilmesi için onu açık kaynaklı hale getirdi. Yazarı tebrik ederiz! Ücretsiz olarak kullanabilseniz de, kodu yeniden yayınlamanın Topluluk Kurallarımıza tabi olduğunu unutmayın.
Feragatname
Bilgiler ve yayınlar, TradingView tarafından sağlanan veya onaylanan finansal, yatırım, alım satım veya diğer türden tavsiye veya öneriler anlamına gelmez ve teşkil etmez. Kullanım Koşulları bölümünde daha fazlasını okuyun.