OPEN-SOURCE SCRIPT
CM_ADX_V1
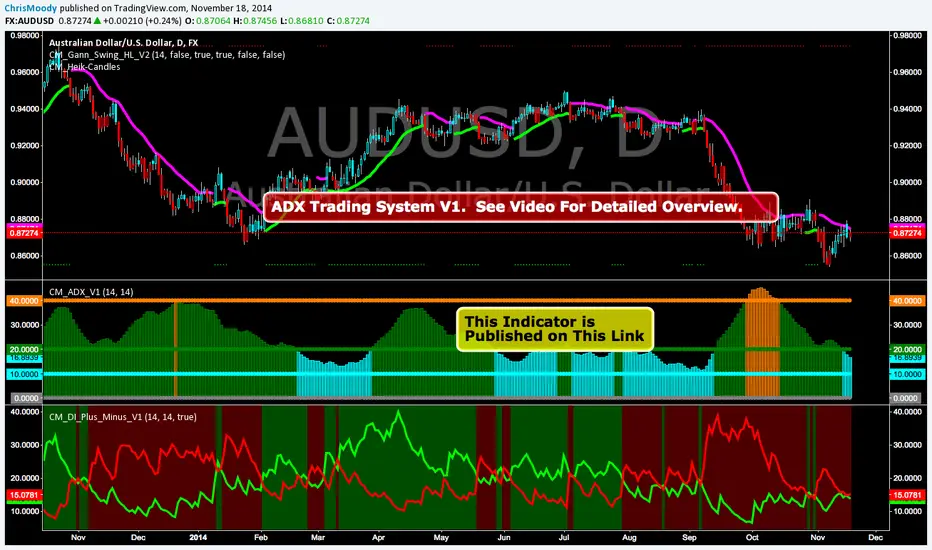
ADX System Overview
So I Came Across Another Trading System for Only $997. However, if you purchased in the next 24hours the whole system could be Yours For Only $497.
So I decided to Code it. This is only Version 1, and I discuss in the Video What I’ve found so for, some plans for Version 2 of the indicator, and I ask for your feedback on anything you find.
Indicators used in System:
CM_DI_Plus_Minus_V1 (Indicator On Bottom).
CM_ADX_V1 (Indicator On 2nd Pane).
CM_Gann_Swing_Hi_Lo (Indicator on Price Pane). This Indicator was published before…Link Below.
tradingview.com/v/ngO3BO37/
CM_DI_Plus_Minus_V1
tradingview.com/v/dZT5qNbk/
In Video I go over settings and how to customize charts.
Link To Video:
vimeopro.com/user32804960/tradingview-indicators/video/112194301
Link To Downloadable PDF Shown in Video:
d.pr/f/JX70
Açık kaynak kodlu komut dosyası
Gerçek TradingView ruhuna uygun olarak, bu komut dosyasının oluşturucusu bunu açık kaynaklı hale getirmiştir, böylece yatırımcılar betiğin işlevselliğini inceleyip doğrulayabilir. Yazara saygı! Ücretsiz olarak kullanabilirsiniz, ancak kodu yeniden yayınlamanın Site Kurallarımıza tabi olduğunu unutmayın.
Coming Soon: ChrisMoodyTrading.com
Feragatname
Bilgiler ve yayınlar, TradingView tarafından sağlanan veya onaylanan finansal, yatırım, işlem veya diğer türden tavsiye veya tavsiyeler anlamına gelmez ve teşkil etmez. Kullanım Şartları'nda daha fazlasını okuyun.