OPEN-SOURCE SCRIPT
Güncellendi Volume Zone Oscillator by [VanHelsig]
Volume Zone Oscillator
How volume zone oscillator work:
Like other VZO it uses the same principle of calculation Volume direction divided on total volume and then scaled to 100 and -100.
When we have positive momentum close > close[loockback] we have value of positive Volume, other way we have -volume negative one. <- this called a volume direction
Total volume is simply moving average with source of volume
And then MA with source of volume direction divided on MA of total colume and scaled it from 100 to -100
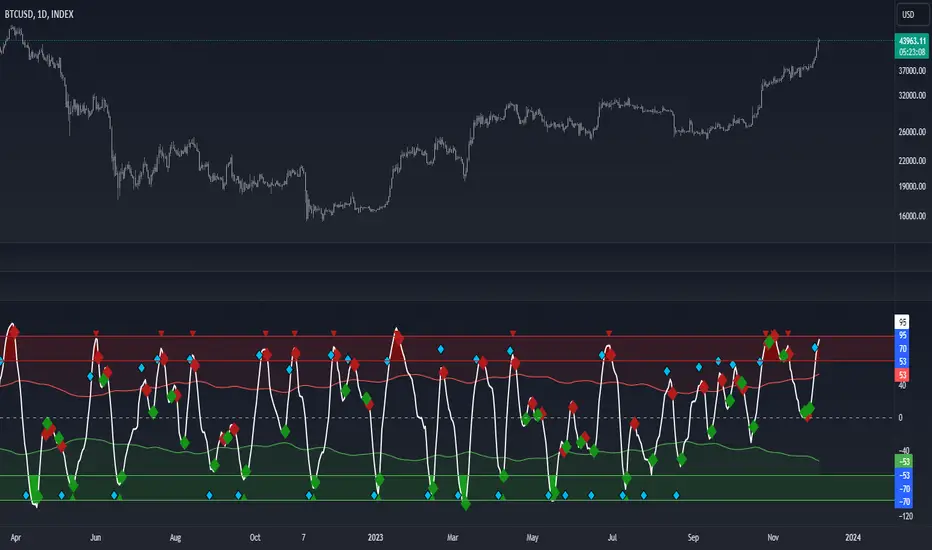
Basically we have few signals what VZO can show:
-Strong buy in oversold zone and strong sell in overbought zone. (Triangles at the top red and at the bottom green)
-Local Buy and Sell (Green and red Robustnesses)
-Posibility of trend change (Blue robustness)
Also you can webhook alerts to your spread sheet that sends values 1 for buys signals and -1 for sell signals in a range of 1 to 10 days
Here you can see marked signals on the chart

How volume zone oscillator work:
Like other VZO it uses the same principle of calculation Volume direction divided on total volume and then scaled to 100 and -100.
When we have positive momentum close > close[loockback] we have value of positive Volume, other way we have -volume negative one. <- this called a volume direction
Total volume is simply moving average with source of volume
And then MA with source of volume direction divided on MA of total colume and scaled it from 100 to -100
Basically we have few signals what VZO can show:
-Strong buy in oversold zone and strong sell in overbought zone. (Triangles at the top red and at the bottom green)
-Local Buy and Sell (Green and red Robustnesses)
-Posibility of trend change (Blue robustness)
Also you can webhook alerts to your spread sheet that sends values 1 for buys signals and -1 for sell signals in a range of 1 to 10 days
Here you can see marked signals on the chart
Sürüm Notları
Updated calculations and backtested. Sürüm Notları
-Sürüm Notları
BackTest BTC Index (BackTest of local buys and local sells) BackTest ETH Index
https://www.tradingview.com/x/Dxb8cWuv/
Sürüm Notları
Organazide code, changed default inputsAçık kaynak kodlu komut dosyası
Gerçek TradingView ruhuyla, bu komut dosyasının mimarı, yatırımcıların işlevselliğini inceleyip doğrulayabilmesi için onu açık kaynaklı hale getirdi. Yazarı tebrik ederiz! Ücretsiz olarak kullanabilseniz de, kodu yeniden yayınlamanın Topluluk Kurallarımıza tabi olduğunu unutmayın.
Feragatname
Bilgiler ve yayınlar, TradingView tarafından sağlanan veya onaylanan finansal, yatırım, alım satım veya diğer türden tavsiye veya öneriler anlamına gelmez ve teşkil etmez. Kullanım Koşulları bölümünde daha fazlasını okuyun.
Açık kaynak kodlu komut dosyası
Gerçek TradingView ruhuyla, bu komut dosyasının mimarı, yatırımcıların işlevselliğini inceleyip doğrulayabilmesi için onu açık kaynaklı hale getirdi. Yazarı tebrik ederiz! Ücretsiz olarak kullanabilseniz de, kodu yeniden yayınlamanın Topluluk Kurallarımıza tabi olduğunu unutmayın.
Feragatname
Bilgiler ve yayınlar, TradingView tarafından sağlanan veya onaylanan finansal, yatırım, alım satım veya diğer türden tavsiye veya öneriler anlamına gelmez ve teşkil etmez. Kullanım Koşulları bölümünde daha fazlasını okuyun.