OPEN-SOURCE SCRIPT
BTC Correlation Percentage
Purpose
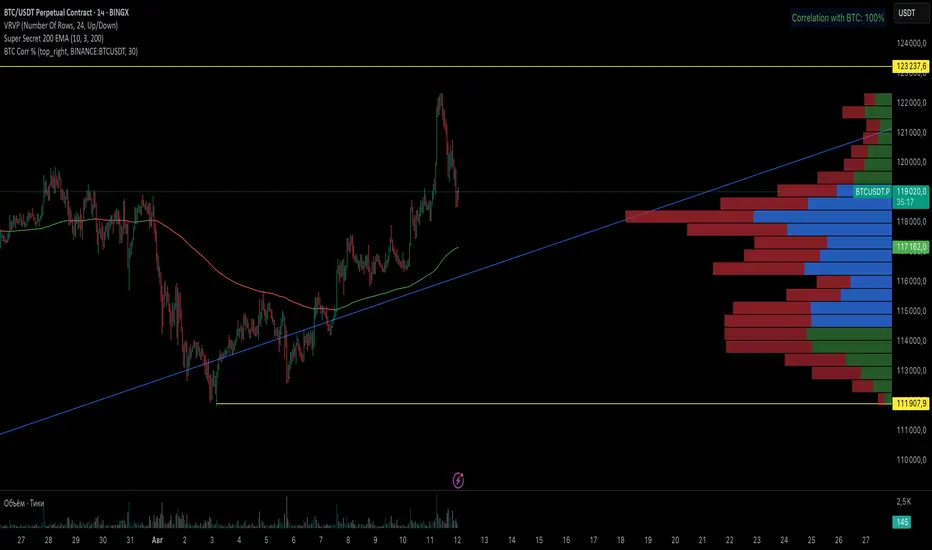
This indicator displays the correlation percentage between the current trading instrument and Bitcoin (BTC/USDT) as a text label on the chart. It helps traders quickly assess how closely an asset's price movements align with Bitcoin's fluctuations.
Key Features
Precise Calculation: Shows correlation as a percentage with one decimal place (e.g., 25.6%).
Customizable Appearance: Allows adjustment of colors, position, and calculation period.
Clean & Simple: Displays only essential information without cluttering the chart.
Universal Compatibility: Works on any timeframe and with any trading pair.
Input Settings
Core Parameters:
BTC Symbol – Ticker for Bitcoin (default: BINANCE:BTCUSDT).
Correlation Period – Number of bars used for calculation (default: 50 candles).
Show Correlation Label – Toggle visibility of the correlation label.
Visual Customization:
Text Color – Label text color (default: white).
Background Color – Label background color (default: semi-transparent blue).
Border Color – Border color around the label (default: gray).
Label Position – Where the label appears on the chart (default: top-right).
Interpreting Correlation Values
70% to 100% → Strong positive correlation (asset moves in sync with BTC).
30% to 70% → Moderate positive correlation.
-30% to 30% → Weak or no correlation.
-70% to -30% → Moderate negative correlation (asset moves opposite to BTC).
-100% to -70% → Strong negative correlation.
Practical Use Cases
For Altcoins: A correlation above 50% suggests high dependence on Bitcoin’s price action.
For Futures Trading: Helps assess systemic risks tied to BTC movements.
During High Volatility: Determines whether an asset’s price change is driven by its own factors or broader market trends.
How It Works
The indicator recalculates automatically with each new candle. For the most reliable results, it is recommended for use on daily or higher timeframes.
This tool provides traders with a quick, visual way to gauge Bitcoin’s influence on other assets, improving decision-making in crypto markets. 🚀
This response is AI-generated, for reference only.
New chat
Açık kaynak kodlu komut dosyası
Gerçek TradingView ruhuyla, bu komut dosyasının mimarı, yatırımcıların işlevselliğini inceleyip doğrulayabilmesi için onu açık kaynaklı hale getirdi. Yazarı tebrik ederiz! Ücretsiz olarak kullanabilseniz de, kodu yeniden yayınlamanın Topluluk Kurallarımıza tabi olduğunu unutmayın.
Feragatname
Bilgiler ve yayınlar, TradingView tarafından sağlanan veya onaylanan finansal, yatırım, alım satım veya diğer türden tavsiye veya öneriler anlamına gelmez ve teşkil etmez. Kullanım Koşulları bölümünde daha fazlasını okuyun.