OPEN-SOURCE SCRIPT
Güncellendi Engulfing Candles Strategy by ardhankurniawan

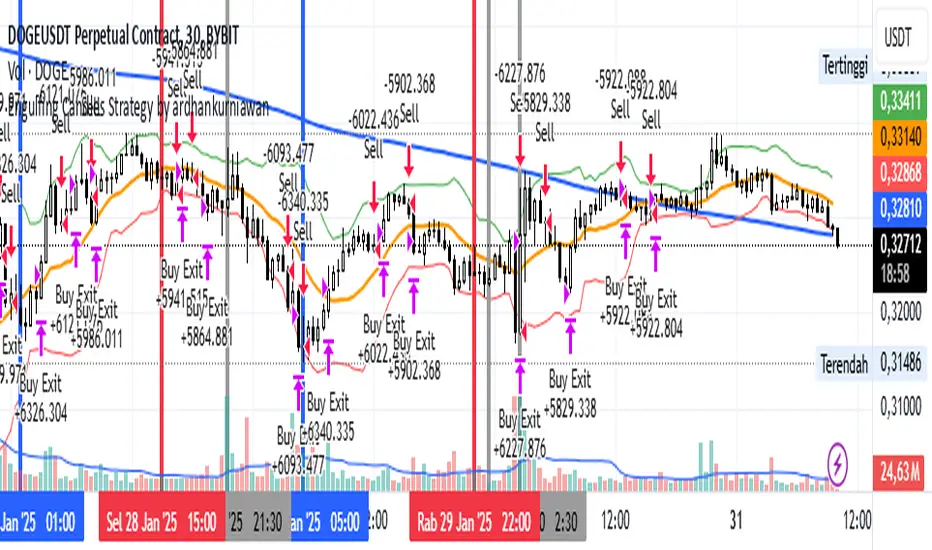
This strategy is based on the Engulfing Candlestick pattern and incorporates a Risk-Reward ratio of 1:2. It utilizes two primary indicators:
1. SMA 200 (200-period Simple Moving Average): Used to identify the overall trend, with buy signals occurring above the SMA and sell signals below it.
2. Bollinger Bands: Provides a volatility-based range for price action. Buy signals occur when the price is above both the SMA 200 and the middle Bollinger Band, while sell signals occur when the price is below both.
The strategy executes a long position (buy) when a Bullish Engulfing candle pattern forms above the SMA 200 and the middle Bollinger Band, and it exits the position using a stop loss at the low of the Bullish Engulfing candle and a take profit at a 1:2 risk-reward ratio. Similarly, a short position (sell) is initiated when a Bearish Engulfing pattern appears below the SMA 200 and the middle Bollinger Band, with the stop loss placed at the high of the Bearish Engulfing candle and a take profit at the same 1:2 risk-reward ratio.
The strategy is designed for trend-following trades with clear entry and exit points based on candlestick patterns and key indicators.
Disclaimer:
This trading strategy is for research purposes only and should not be considered as financial or investment advice. The use of this strategy involves risk, and past performance is not indicative of future results. Always conduct your own research and consult with a financial advisor before making any investment decisions. Trading involves significant risk, and you could lose more than your initial investment. By using this strategy, you agree to take full responsibility for any trades executed and the associated risks.
Sürüm Notları
This strategy is based on the Engulfing Candlestick pattern and incorporates a Risk-Reward ratio of 1:2. It utilizes two primary indicators:1. SMA 200 (200-period Simple Moving Average): Used to identify the overall trend, with buy signals occurring above the SMA and sell signals below it.
2. Bollinger Bands: Provides a volatility-based range for price action. Buy signals occur when the price is above both the SMA 200 and the middle Bollinger Band, while sell signals occur when the price is below both.
The strategy executes a long position (buy) when a Bullish Engulfing candle pattern forms above the SMA 200 and the middle Bollinger Band, and it exits the position using a stop loss at the low of the Bullish Engulfing candle and a take profit at a 1:2 risk-reward ratio. Similarly, a short position (sell) is initiated when a Bearish Engulfing pattern appears below the SMA 200 and the middle Bollinger Band, with the stop loss placed at the high of the Bearish Engulfing candle and a take profit at the same 1:2 risk-reward ratio.
The strategy is designed for trend-following trades with clear entry and exit points based on candlestick patterns and key indicators.
Disclaimer:
This trading strategy is for research purposes only and should not be considered as financial or investment advice. The use of this strategy involves risk, and past performance is not indicative of future results. Always conduct your own research and consult with a financial advisor before making any investment decisions. Trading involves significant risk, and you could lose more than your initial investment. By using this strategy, you agree to take full responsibility for any trades executed and the associated risks.
Sürüm Notları
Rev v.2Adding offset limit from SMA 200 of +- 0.55%.
Rev v.3
Adding 200 SMA trend conditions, bullish trend continues (consecutive higher highs) or bearish trend continues (consecutive lower lows).
Sürüm Notları
Rev v.4Deleting offset limit from SMA 200 of +- 0.55% and the middle Bollinger Band.
Feragatname
Bilgiler ve yayınlar, TradingView tarafından sağlanan veya onaylanan finansal, yatırım, işlem veya diğer türden tavsiye veya tavsiyeler anlamına gelmez ve teşkil etmez. Kullanım Şartları'nda daha fazlasını okuyun.