OPEN-SOURCE SCRIPT
Güncellendi Up Down Volume Ratio by 3iau
This script considers the total volume within a user specified time frame, and whether price closed higher or lower at the end of each period within that time frame.
EXAMPLE:
* If the time period of interest is 50-periods, the script considers the volume within each of those 50 periods beginning with the most recent closed period.
* SumUpVol = the sum of all volume occurring within only those periods where price closed higher than that of the previous period.
* SumDnVol = the sum of all volume occurring within only those periods where price closed lower than that of the previous period.
* Difference = the difference between SumUpVol and SumDnVol = SumUpVol - SumDnVol
* Total = the sum of SumUpVol and SumDnVol = SumUpVol + SumDnVol
* The plot will present the change in Difference divided by Total = Difference/Total = (SumUpVol - SumDnVol)/(SumUpVol + SumDnVol) occurring within those 50 periods. What will be plotted is the moving average of this value. The user can specify the moving average type and the number of period for which the average is calculated.
* The plot needs to be fitted into a range, for example, +/- 50 (default) or +/-100, by multiplying the result of Difference/Total by a user specified constant. The constant will contain the majority (not all) of the values within +/- the specified value.
* Range = the user specified constant. If Range = 50, the majority of values plotted will be fall within the range +/- 50.
* Therefore, what is plotted is the moving average of Range * Difference / Total.
* When the value = 0, accumulation = distribution over the user specified 50-periods time frame.
* When the value is positive, accumulation > distribution over the user specified 50-periods time frame.
* When the value is negative, distribution > accumulation over the user specified 50-periods time frame.
This plot allows one to see possible accumulation and distribution occurring within a particular stock. The slope of this plot must be considered, and not any single value. The selected constant (“Range” in the example above) does not have an effect on the slope of the plot.
Three values may be plotted at once, for comparison of accumulation or distribution occurring over different time frames. For example, compare Difference / Total calculated over a 50-periods timeframe with 10-periods timeframe, both time frames beginning with the most recent closed period.
In addition to the above, J. Welles Wilder’s Relative Strength Index (RSI) can be plotted over the Difference / Total.
NOTE: this script is not the same as the more commonly used Up/Down Volume Ratio defined as SumUpVol / SumDnVol over a 50-periods time frame, where SumUpVol = the sum of all volume occurring within only those periods where price closed higher than that of the previous period, and SumDnVol = the sum of all volume occurring within only those periods where price closed lower than that of the previous period.
Compare...
Up Down Volume Ratio = SumUpVol / SumDnVol
Up Down Volume Ratio by 3iau = the moving average of Range * (SumUpVol - SumDnVol) / (SumUpVol + SumDnVol)
Sürüm Notları
Added notes in the script for clarity.Changed defaults and added the ability to change the price used for calculations: close, typical, etc.
Sürüm Notları
Reformatted settings.Added standard deviation.
Sürüm Notları
Added notes and edited the settings.Sürüm Notları
Added plots: 1) (UpVolume - DownVolume) / 10^Scale.
2) (UpVolume / DownVolume) * Multiplier.
Added some tooltips.
Sürüm Notları
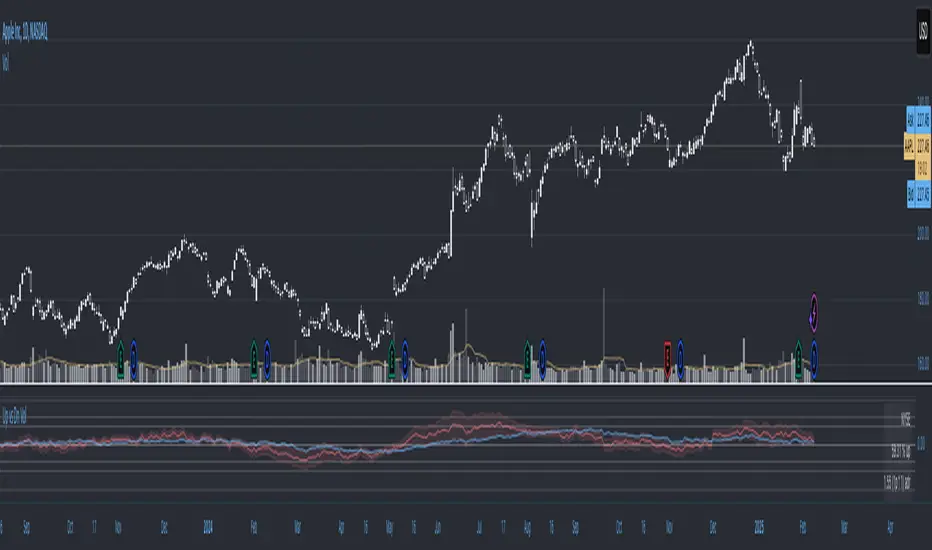
Changed the chart for perhaps a better example of the plots usefulness in revealing a change in volume from buying to selling despite ongoing increasing price... a potential sign of a coming change in price movement.Sürüm Notları
Add OBV oscillator to the list of overlay plots.Sürüm Notları
Added a table for exchange information: % up volume, % down volume, % unchanged volume, TICK, TRIN.Sürüm Notları
edited tooltips to help clarify settings optionsSürüm Notları
Added a list of constants for use as an optional multiplier applied to the standard deviation.Sürüm Notları
fixed a spelling errorSürüm Notları
Edited the OBV oscillator overlay script.Sürüm Notları
Updated indicator table.Sürüm Notları
added tooltipsSürüm Notları
Added table data: Zweig Breadth Ratio, Lowry Breadth Ratio, Whaley Breadth Ratio.Sürüm Notları
Table data: added NYSE and NSADAQ 10EMA of up points / 10EMA of (up points + down points) for comparison with 10EMA of up volume / 10EMA of (up volume + down volume) and 10EMA of advancing / 10EMA of (advancing issues + declining issues) Sürüm Notları
Edited the plot of breath thrust indictors so that the display of column and area plots would better convey bullish and bearish regions.Found and fixed an error in the table displayed.
Sürüm Notları
Edited the OBV oscillator overlay and added a tooltip to explain its use. Notes were also added into the script itself.Sürüm Notları
Updated defaults, added comments in the script, added tooltips.Sürüm Notları
Improved user inputs and tooltipsSürüm Notları
Reworked and reorganized some of the script. Edited tooltips. Sürüm Notları
Fixed typoAçık kaynak kodlu komut dosyası
Gerçek TradingView ruhuna uygun olarak, bu komut dosyasının oluşturucusu bunu açık kaynaklı hale getirmiştir, böylece yatırımcılar betiğin işlevselliğini inceleyip doğrulayabilir. Yazara saygı! Ücretsiz olarak kullanabilirsiniz, ancak kodu yeniden yayınlamanın Site Kurallarımıza tabi olduğunu unutmayın.
Feragatname
Bilgiler ve yayınlar, TradingView tarafından sağlanan veya onaylanan finansal, yatırım, işlem veya diğer türden tavsiye veya tavsiyeler anlamına gelmez ve teşkil etmez. Kullanım Şartları'nda daha fazlasını okuyun.
Açık kaynak kodlu komut dosyası
Gerçek TradingView ruhuna uygun olarak, bu komut dosyasının oluşturucusu bunu açık kaynaklı hale getirmiştir, böylece yatırımcılar betiğin işlevselliğini inceleyip doğrulayabilir. Yazara saygı! Ücretsiz olarak kullanabilirsiniz, ancak kodu yeniden yayınlamanın Site Kurallarımıza tabi olduğunu unutmayın.
Feragatname
Bilgiler ve yayınlar, TradingView tarafından sağlanan veya onaylanan finansal, yatırım, işlem veya diğer türden tavsiye veya tavsiyeler anlamına gelmez ve teşkil etmez. Kullanım Şartları'nda daha fazlasını okuyun.