OPEN-SOURCE SCRIPT
Dynamic SMA
Timeframe Detection: The indicator first identifies the current timeframe of the chart (e.g., daily, 4-hour, 1-hour).
SMA Calculation: It calculates three different SMAs:
Daily SMA: A 8-period SMA calculated on daily closing prices.
4-Hour SMA: A 50-period SMA calculated on 4-hour closing prices.
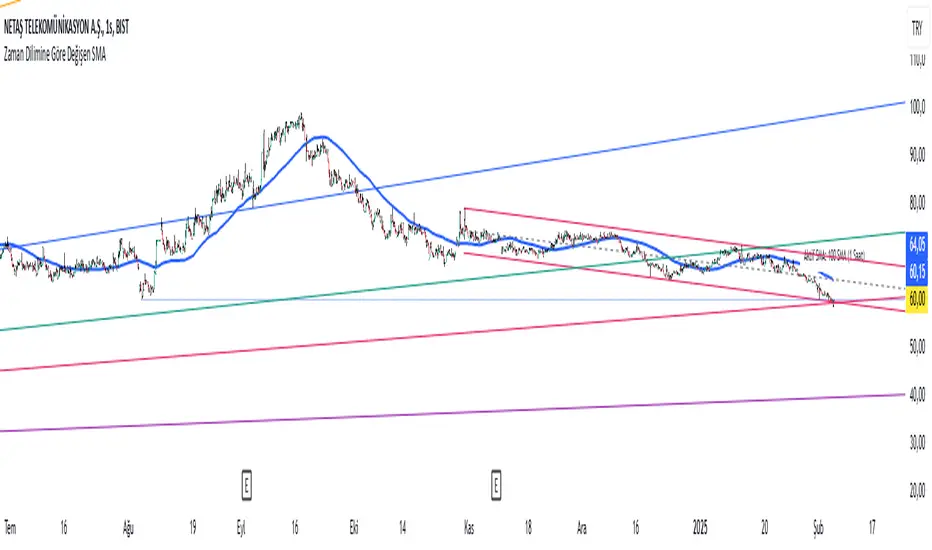
1-Hour SMA: A 100-period SMA calculated on 1-hour closing prices.
Dynamic SMA Selection: Based on the detected timeframe, the indicator selects the appropriate SMA to display:
If the timeframe is daily, it uses the daily SMA.
If the timeframe is 4-hour, it uses the 4-hour SMA.
If the timeframe is 1-hour, it uses the 1-hour SMA.
Plotting: The selected SMA is plotted on the chart as a blue line.
Dynamic Label: The indicator also creates a dynamic label that displays the current SMA being used, along with the corresponding timeframe and period. For example, it will show "Active SMA: 8 SMA (Daily)" when the daily SMA is active.
This indicator is useful for traders who want to use different SMAs for different timeframes without having to manually switch between them. It provides a convenient way to see the relevant SMA for the current chart view.
SMA Calculation: It calculates three different SMAs:
Daily SMA: A 8-period SMA calculated on daily closing prices.
4-Hour SMA: A 50-period SMA calculated on 4-hour closing prices.
1-Hour SMA: A 100-period SMA calculated on 1-hour closing prices.
Dynamic SMA Selection: Based on the detected timeframe, the indicator selects the appropriate SMA to display:
If the timeframe is daily, it uses the daily SMA.
If the timeframe is 4-hour, it uses the 4-hour SMA.
If the timeframe is 1-hour, it uses the 1-hour SMA.
Plotting: The selected SMA is plotted on the chart as a blue line.
Dynamic Label: The indicator also creates a dynamic label that displays the current SMA being used, along with the corresponding timeframe and period. For example, it will show "Active SMA: 8 SMA (Daily)" when the daily SMA is active.
This indicator is useful for traders who want to use different SMAs for different timeframes without having to manually switch between them. It provides a convenient way to see the relevant SMA for the current chart view.
Açık kaynak kodlu komut dosyası
Gerçek TradingView ruhuyla, bu komut dosyasının mimarı, yatırımcıların işlevselliğini inceleyip doğrulayabilmesi için onu açık kaynaklı hale getirdi. Yazarı tebrik ederiz! Ücretsiz olarak kullanabilseniz de, kodu yeniden yayınlamanın Topluluk Kurallarımıza tabi olduğunu unutmayın.
Feragatname
Bilgiler ve yayınlar, TradingView tarafından sağlanan veya onaylanan finansal, yatırım, alım satım veya diğer türden tavsiye veya öneriler anlamına gelmez ve teşkil etmez. Kullanım Koşulları bölümünde daha fazlasını okuyun.