OPEN-SOURCE SCRIPT
Acceleration Bands
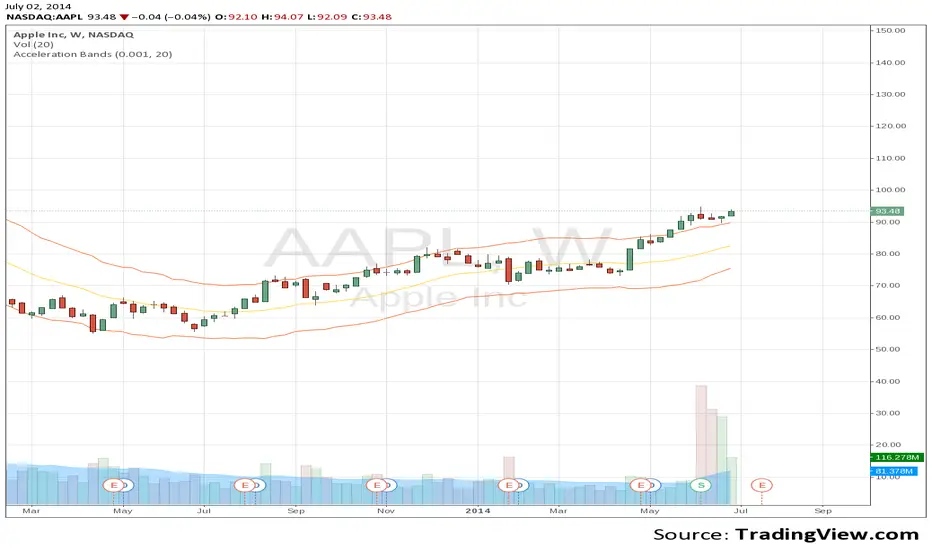
Price Headley\'s Acceleration Bands serve as a trading envelope that factor in a stock\'s typical volatility over standard settings of 20 or 80 bars. They can be used across any time frame, though Headley prefers to use them most across weekly and monthly timeframes as breakout indicators outside these bands, while using the shorter time frames to define likely support and resistance levels at the lower and upper Acceleration Bands. Acceleration Bands are plotted around a simple moving average as the midpoint, and the upper and lower bands are of equal distance from this midpoint.
swingtracker.com/content.php?content=technical_accband
forex-indicators.net/acceleration-bands
swingtracker.com/content.php?content=technical_accband
forex-indicators.net/acceleration-bands
Açık kaynak kodlu komut dosyası
Gerçek TradingView ruhuna uygun olarak, bu komut dosyasının oluşturucusu bunu açık kaynaklı hale getirmiştir, böylece yatırımcılar betiğin işlevselliğini inceleyip doğrulayabilir. Yazara saygı! Ücretsiz olarak kullanabilirsiniz, ancak kodu yeniden yayınlamanın Site Kurallarımıza tabi olduğunu unutmayın.
Feragatname
Bilgiler ve yayınlar, TradingView tarafından sağlanan veya onaylanan finansal, yatırım, işlem veya diğer türden tavsiye veya tavsiyeler anlamına gelmez ve teşkil etmez. Kullanım Şartları'nda daha fazlasını okuyun.