PROTECTED SOURCE SCRIPT
GTO
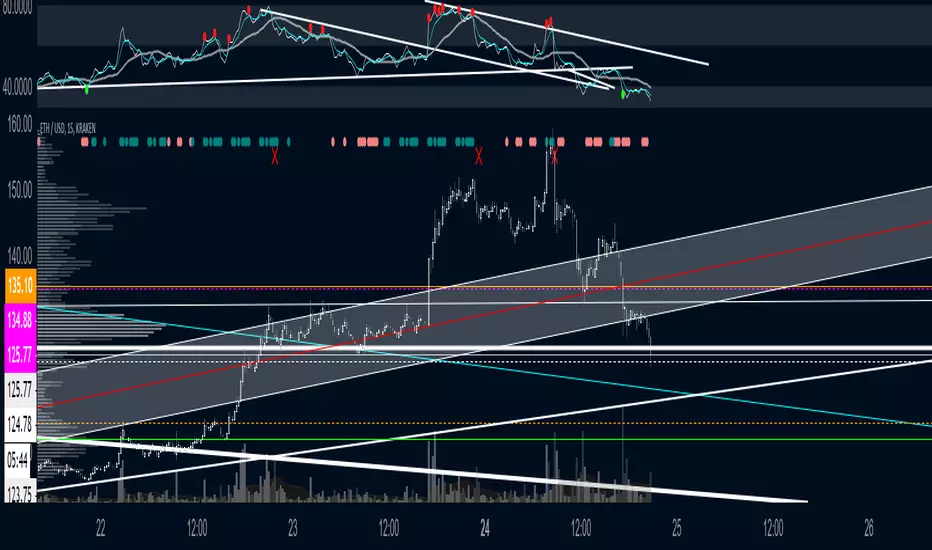
GTO is a easy to understand and use script
it just uses candle closes and other variables to gauge momentum that is then plotted on top of the chart
teal = bullish
salmon = bearish
you want them plotting while in your desired trade, if you are long and bearishness starts showing may be good toexit vise versa
Red X is BULL fatigue or can other wise be seen as bearish
Green X is the opposite
@satoshiiheavy
Technical Analyst for cryptcurrentlyvip.com
Korumalı komut dosyası
Bu komut dosyası kapalı kaynak olarak yayınlanmaktadır. Ancak, özgürce ve herhangi bir sınırlama olmaksızın kullanabilirsiniz – daha fazla bilgi burada.
Have a plan. Trade it!
Feragatname
Bilgiler ve yayınlar, TradingView tarafından sağlanan veya onaylanan finansal, yatırım, işlem veya diğer türden tavsiye veya tavsiyeler anlamına gelmez ve teşkil etmez. Kullanım Şartları'nda daha fazlasını okuyun.