PROTECTED SOURCE SCRIPT
Güncellendi Trend Strength Indicator
How to use?
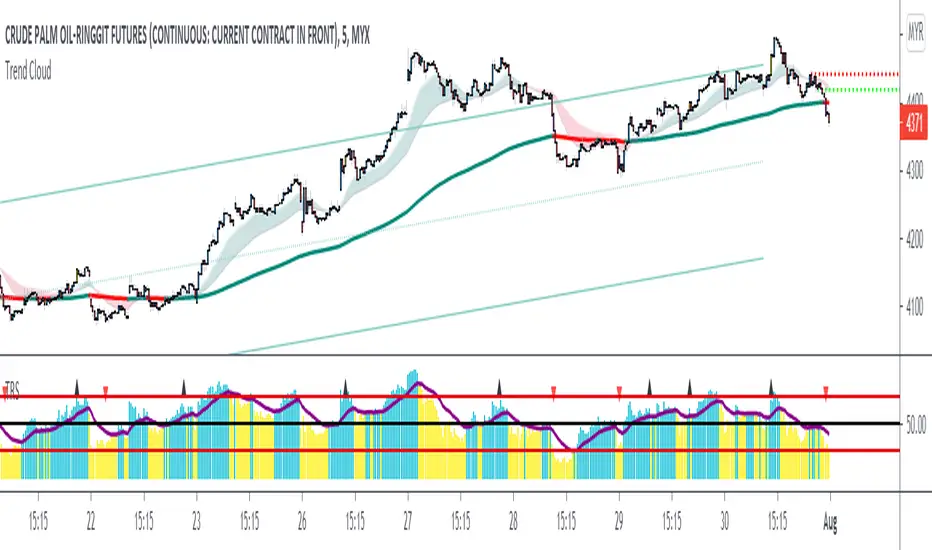
1) The purple line summarizes the overall trend strength.
If the purple line is above 50, the market is considered to be bullish
If the purple line is below 50, the market is then considered to be bearish
Buy-Long position can be considered when the purple line is crossing up the 50-line and exit-long position can be considered vice versa.
However it is best to let the purple line to test the 50 line after crossing.
2) Each bar represents the each price movement strength index.
If the bar is above the purple line, the bar's color will become blue, indicating that the price is gaining momentum.
If the bar is below the purple line, the bar's color will turn to yellow, indicating the prices is losing momentum.
Default setting is period : 20, average : 20. It can be customized based on trading style and risk tolerance.
Sürüm Notları
Changed default setting from 20/20 to 14/14Change lower base from 20 to 0
Sürüm Notları
Adjusted the precision for divergence Sürüm Notları
1) Updated calculation coding and default setting (14/14 to 14/20) to reduce noise2) Add up color bar coding. When Average line crosses up 50 line, bar color will turn to yellow and turns to purple when crosses down 50-line
Sürüm Notları
1) Updated name from Trend Strength Indicator to Trend Relative Strength2) Introduced input for average up & average down control
Korumalı komut dosyası
Bu komut dosyası kapalı kaynak olarak yayınlanmaktadır. Ancak, ücretsiz ve herhangi bir sınırlama olmaksızın kullanabilirsiniz – daha fazla bilgiyi buradan edinebilirsiniz.
Feragatname
Bilgiler ve yayınlar, TradingView tarafından sağlanan veya onaylanan finansal, yatırım, alım satım veya diğer türden tavsiye veya öneriler anlamına gelmez ve teşkil etmez. Kullanım Koşulları bölümünde daha fazlasını okuyun.