[HuD] BURSA Buy|Sell V1
So using ATR and ema lines I build this indicator which I hope it can guide trader to make that decision.
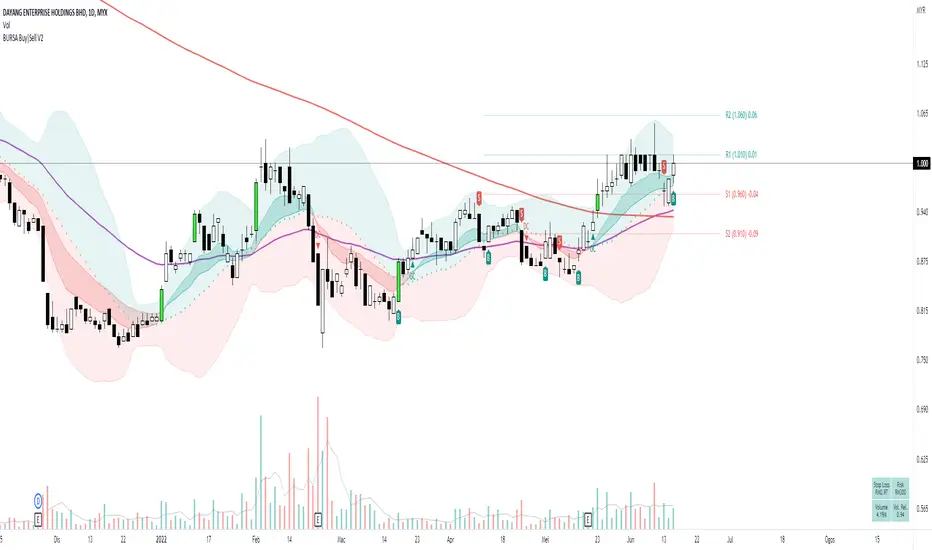
This indicator contains :
I. Bollinger Band with standard-setting
- Green Zone indicates a positive trend, while red is negative trend
2. Moving average line ( I recommend using ema ) which are ema5,10,20, 50 and sma200
- ema10 and 20 are represented by green ribbon ( when its uptrend = ema10 is bigger value than ema20 ) and red ( when its downtrend)
- I'm also using ema7 and ema 21 as guides for the beginning of uptrend/downtrend. Represented by a green and red triangle
3. Default ATR setting is 10 with 1 multiplication
4. Buy Sell signal represented with labels B and S
- It acts as a guide on where to make the entry or exit. It acts as a guide and traders can decide to Entry at BUY signal and exit at SELL signal.
- Traders can also consider taking the BUY entry even after they miss the BUY signal if the price did not close lower than the opening price of BUY candle, which is 2 to 3 candles after the signal.
- SELL signal acts as a guide when it breaks the trailing stop line. Traders will have the option to exit the trade if they follow this signal or wait for another 1 or 2 candles.
5. Breakout Candle
- when the candle breaks the highest level of the previous 5 candles with volume > average 5 days, the candle's color will change to lime green.
6. Line High and Low ( need to turn on at setting menu )
- act as support and resistance guide
7. EMA Crossing
There is an option to display the Golden Cross (GC) and Death Cross (DC) of ema lines such as :
Golden Cross (GC) - Green Label
- EMA5 Crossover EMA20
- EMA20 Crossover EMA50
- EMA50 Crossover MA200
Death Cross (DC) - Red Label
- EMA5 Crossunder EMA20
- EMA20 Crossunder EMA50
- EMA50 Crossunder MA200
8. Table Info will display :
- Stop Loss Information
- Risk
- Current Volume
- Relative Volume. If relative volume > 1, means the current volume is higher than normal volume. For example, if RV = 5, meaning current trading volume is very active and it's 5 times higher than average volume.
This is only version 1 and will be upgraded from time to time. Hope this indicator can help traders in making wise decision in trading.
.
- Updated with Gann Level which acts as a guide for support and resistance.
- Gann Level also include Risk / Reward
- Pinescript code upgraded and tidy up script.
Yalnızca davetli komut dosyası
Bu komut dosyasına yalnızca yazar tarafından onaylanan kullanıcılar erişebilir. Kullanmak için izin istemeniz ve almanız gerekir. Bu izin genellikle ödeme yapıldıktan sonra verilir. Daha fazla ayrıntı için aşağıdaki yazarın talimatlarını izleyin veya doğrudan Hud_Hud ile iletişime geçin.
TradingView, yazarına tam olarak güvenmediğiniz ve nasıl çalıştığını anlamadığınız sürece bir komut dosyası için ödeme yapmanızı veya kullanmanızı ÖNERMEZ. Ayrıca topluluk komut dosyaları bölümümüzde ücretsiz, açık kaynaklı alternatifler bulabilirsiniz.
Yazarın talimatları
Uyarı: Erişim talebinde bulunmadan önce lütfen yalnızca davetli komut dosyaları kılavuzumuzu okuyun.
Telegram Channel : t.me/HudHudAlert
TV Indicator : my.tradingview.com/u/Hud_Hud/
Feragatname
Yalnızca davetli komut dosyası
Bu komut dosyasına yalnızca yazar tarafından onaylanan kullanıcılar erişebilir. Kullanmak için izin istemeniz ve almanız gerekir. Bu izin genellikle ödeme yapıldıktan sonra verilir. Daha fazla ayrıntı için aşağıdaki yazarın talimatlarını izleyin veya doğrudan Hud_Hud ile iletişime geçin.
TradingView, yazarına tam olarak güvenmediğiniz ve nasıl çalıştığını anlamadığınız sürece bir komut dosyası için ödeme yapmanızı veya kullanmanızı ÖNERMEZ. Ayrıca topluluk komut dosyaları bölümümüzde ücretsiz, açık kaynaklı alternatifler bulabilirsiniz.
Yazarın talimatları
Uyarı: Erişim talebinde bulunmadan önce lütfen yalnızca davetli komut dosyaları kılavuzumuzu okuyun.
Telegram Channel : t.me/HudHudAlert
TV Indicator : my.tradingview.com/u/Hud_Hud/