OPEN-SOURCE SCRIPT
Horizontal lines by Aydmaxx
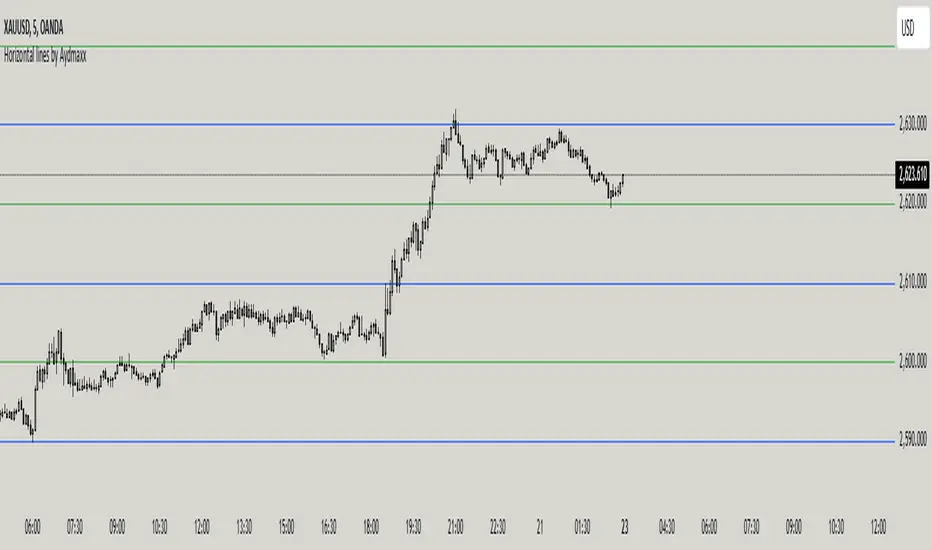
Indicator Description: Horizontal Lines by Aydmaxx
This indicator plots customizable horizontal lines on the chart to assist with technical analysis. It allows traders to define a starting price and a step size (gap) between the lines, making it versatile for a variety of strategies, such as identifying support, resistance, or key price levels.
How to Use:
Starting Price (Bottom): Enter the price level where the first (lowest) line should begin. This is your base level.
Example: If you're analyzing a market with prices around 2550, you can set this value to 2550 to align the indicator with your focus.
Gap (Step Size): Specify the interval or step size between consecutive lines.
Example: If you want lines every 10 points, set this value to 10.
Number of Lines: Adjust the total number of lines to display on the chart.
Line Style and Width: Customize the appearance of the lines (solid, dashed, dotted) and their thickness.
Line Colors and Transparency: Choose primary and secondary colors for alternating lines, and adjust the transparency to match your visual preferences.
This indicator is ideal for visualizing price zones and can be tailored to suit any trading style. Adjust the parameters based on your market analysis to highlight key price levels effectively.
Açık kaynak kodlu komut dosyası
Gerçek TradingView ruhuyla, bu komut dosyasının mimarı, yatırımcıların işlevselliğini inceleyip doğrulayabilmesi için onu açık kaynaklı hale getirdi. Yazarı tebrik ederiz! Ücretsiz olarak kullanabilseniz de, kodu yeniden yayınlamanın Topluluk Kurallarımıza tabi olduğunu unutmayın.
Feragatname
Bilgiler ve yayınlar, TradingView tarafından sağlanan veya onaylanan finansal, yatırım, alım satım veya diğer türden tavsiye veya öneriler anlamına gelmez ve teşkil etmez. Kullanım Koşulları bölümünde daha fazlasını okuyun.