OPEN-SOURCE SCRIPT
[jT] Real Candles
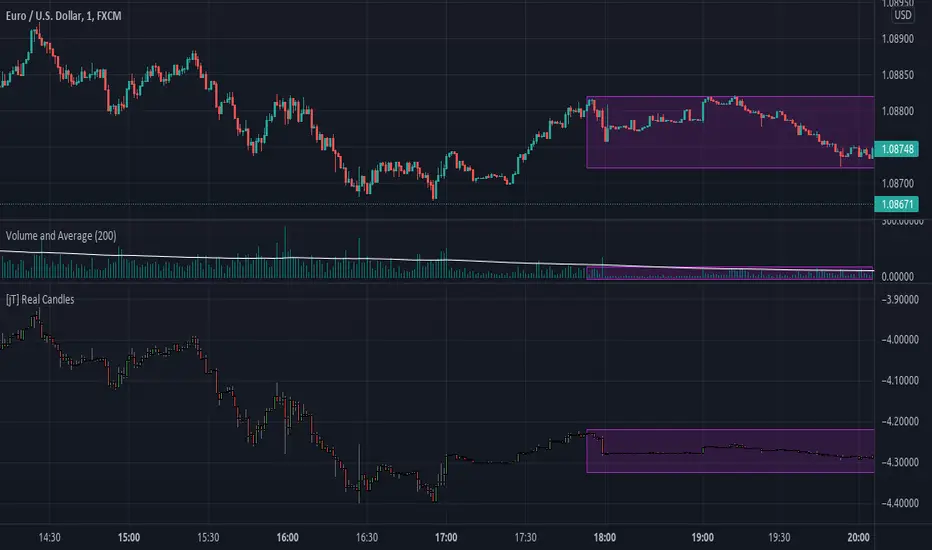
This is an "indicator" that takes the candle's size and multiply it by the current volume, so now the candle size is affected by how much volume is being traded.
Here we assume that the volume traded is essential, and now it kinda have a weight on how the price acts. So "dead-volume" areas will be almost inexpressive in the chart, while the areas with huge volume are where the volatility really happens.
Note: the purple rectangles aren't part of the script, they are just to show how a area with no volume behaves.
Açık kaynak kodlu komut dosyası
Gerçek TradingView ruhuyla, bu komut dosyasının mimarı, yatırımcıların işlevselliğini inceleyip doğrulayabilmesi için onu açık kaynaklı hale getirdi. Yazarı tebrik ederiz! Ücretsiz olarak kullanabilseniz de, kodu yeniden yayınlamanın Topluluk Kurallarımıza tabi olduğunu unutmayın.
Feragatname
Bilgiler ve yayınlar, TradingView tarafından sağlanan veya onaylanan finansal, yatırım, alım satım veya diğer türden tavsiye veya öneriler anlamına gelmez ve teşkil etmez. Kullanım Koşulları bölümünde daha fazlasını okuyun.