OPEN-SOURCE SCRIPT
All Weekly Opens + Week Label
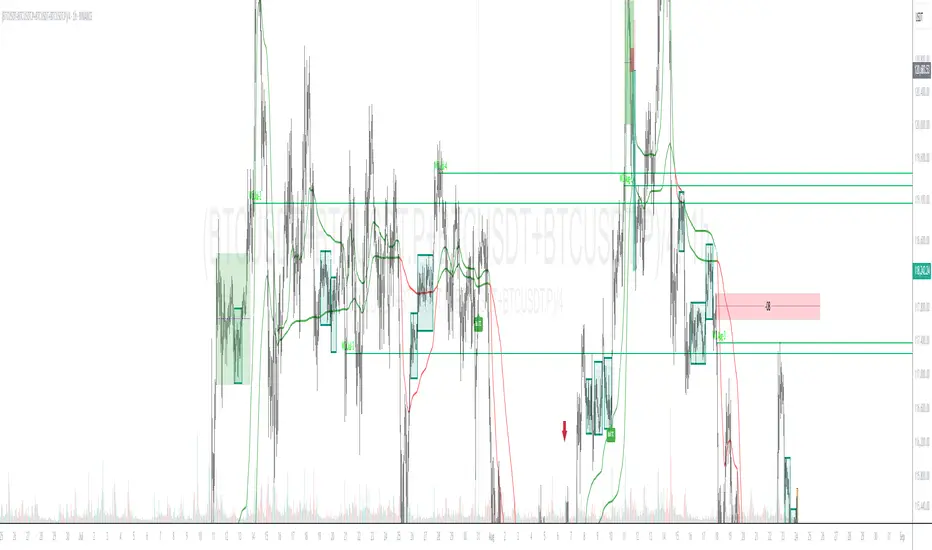
This script plots every Weekly Open (WO) across the entire chart, making it easy for traders to backtest how price reacts to weekly opens historically.
Each weekly open is drawn as a horizontal line and labeled with the month abbreviation and the week number of that month (e.g., WO Aug-4). This allows traders to quickly identify where each weekly session started and analyze market behavior around these key reference levels.
How it works
The script detects the first bar of each new week and records its opening price.
A horizontal line is drawn at that price, extending to the right.
An optional label shows the week name in the format Month-WeekNumber.
Traders can enable or disable labels, change line colors, line width, and optionally display the opening price in the label.
A new input allows filtering to show only the last N months of Weekly Opens. By default, all weekly opens are displayed, but traders can limit the chart to just the most recent ones for a cleaner view.
Why it’s useful
Weekly opens are often respected levels in both intraday and swing trading. They provide natural reference points for:
Backtesting market reactions to session opens.
Identifying areas of support/resistance around weekly levels.
Aligning trade entries and exits with higher-timeframe context.
Simplifying charts by focusing only on the most relevant recent weeks.
Notes
This indicator is not a trading signal generator.
It should be used as a contextual tool for analysis, helping traders improve risk management and entry precision.
Works on all symbols and timeframes.
The “last N months” filter is optional; setting it to 0 will plot all Weekly Opens available in the chart’s history.
Açık kaynak kodlu komut dosyası
Gerçek TradingView ruhuyla, bu komut dosyasının mimarı, yatırımcıların işlevselliğini inceleyip doğrulayabilmesi için onu açık kaynaklı hale getirdi. Yazarı tebrik ederiz! Ücretsiz olarak kullanabilseniz de, kodu yeniden yayınlamanın Topluluk Kurallarımıza tabi olduğunu unutmayın.
Feragatname
Bilgiler ve yayınlar, TradingView tarafından sağlanan veya onaylanan finansal, yatırım, alım satım veya diğer türden tavsiye veya öneriler anlamına gelmez ve teşkil etmez. Kullanım Koşulları bölümünde daha fazlasını okuyun.