OPEN-SOURCE SCRIPT
Option Buying Pivot and SMA 3 Pivot crossover
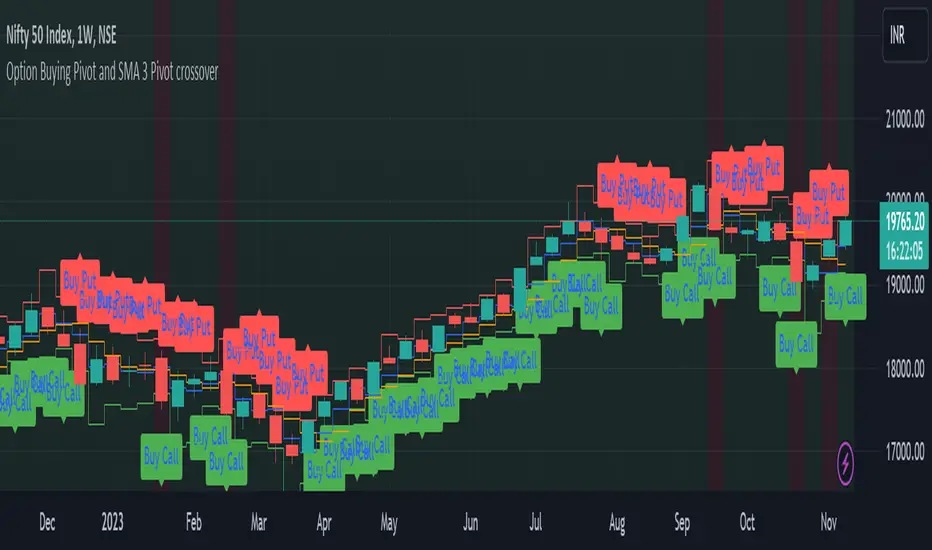
This script is designed as a visual aid for options trading specifically for option buying, providing information about potential entry points, Option levels, and trade outcomes. Here's a summary of the key elements:
1. Pivot Point and True Range:*
- The script calculates the current candle's pivot point, representing an average of high, low, and close prices from the previous candle.
- True range, a measure of volatility, is determined using the high, low, and close prices of the last two candles.
2. Option Levels:
- Downside (PutValue - Red colour line) and upside (CallValue - Green Colour line) are calculated based on the current pivot point and true range.
PutValue = currentCandlePivot + currentCandleTrueRange
CallValue = currentCandlePivot - currentCandleTrueRange
3. Simple Moving Average (SMA) of Pivot Point:
- A 3-period SMA is applied to the pivot point to smooth out fluctuations.
4. Trade Entry Logic:
- Long entry is signalled when the current pivot point is above the SMA. (longEntry = currentCandlePivot > smaPivot)
- At the time of long entry BUY THE CALL OPTION OR SELL THE PUT OPTION near the CallValue Green line
- Short entry is signalled when the current pivot point is below the SMA. (shortEntry = currentCandlePivot < smaPivot)
- At the time of Short entry BUY THE PUT OPTION OR SELL THE CALL OPTION near the PutValue Red line
The indicator having option to change the background of the candle as a green for long; and change the background of the candle as red for short. Also, Having the option to plot as label.
5. Win and Loss Logic:
- Winning conditions are assessed based on the close price relative to CallValue (for Long) and PutValue (for Short).
- Losing conditions are determined similarly.
- winLong = close > CallValue and longEntry
- winShort = close < PutValue and shortEntry
-lossLong = close < CallValue and longEntry
-lossShort = close > PutValue and shortEntry
The indicator having option to change the background of the candle as a green for win; and change the background of the candle as red for loss. Also, Having the option to plot as label.
6. Background Coloring and Plots:
- The script uses background colors to highlight Long, Short, Win, and Loss scenarios.
- Shapes and labels are plotted on the chart to visually represent entry points, stop-loss levels, and trade outcomes.
The overall purpose is to provide traders with a clear visual representation of potential trading opportunities and outcomes, helping them make informed decisions in the options market.
Açık kaynak kodlu komut dosyası
Gerçek TradingView ruhuyla, bu komut dosyasının mimarı, yatırımcıların işlevselliğini inceleyip doğrulayabilmesi için onu açık kaynaklı hale getirdi. Yazarı tebrik ederiz! Ücretsiz olarak kullanabilseniz de, kodu yeniden yayınlamanın Topluluk Kurallarımıza tabi olduğunu unutmayın.
Feragatname
Bilgiler ve yayınlar, TradingView tarafından sağlanan veya onaylanan finansal, yatırım, alım satım veya diğer türden tavsiye veya öneriler anlamına gelmez ve teşkil etmez. Kullanım Koşulları bölümünde daha fazlasını okuyun.