OPEN-SOURCE SCRIPT
Previous_DWMQY_High/Low & Pivots
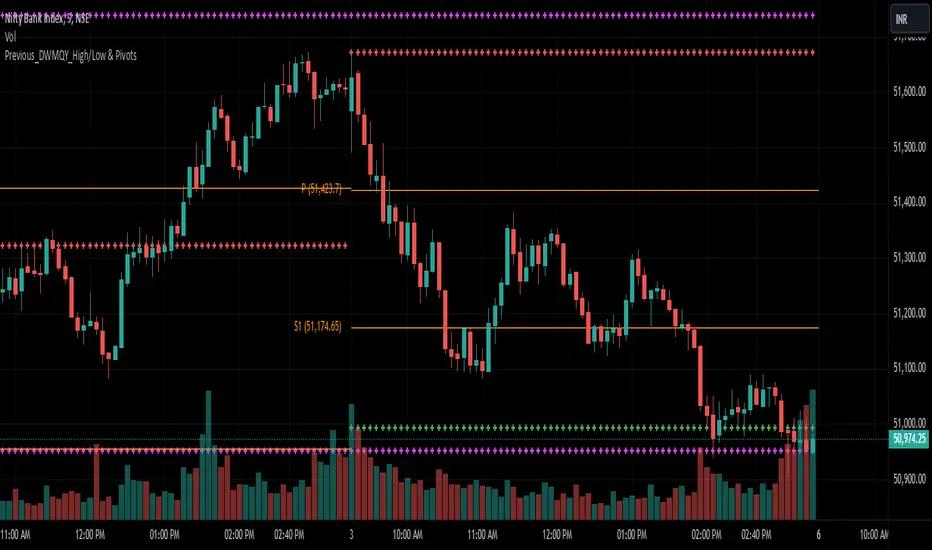
This script calculates high/low pivots for different timeframes (daily, weekly, monthly, quarterly, and yearly). You have various pivot point calculation methods (Traditional, Fibonacci, Woodie, Classic, DM, Camarilla) and have inputs that allow customization of the indicator. The script also accounts for custom year-based calculations (bi-yearly, tri-yearly, quinquennially, decennially).
The first part of your code calculates the high and low levels for different timeframes, which are plotted on the chart as crosses. The second part involves the pivot point calculations, where the user selects the type of pivot point calculation (Traditional, Fibonacci, etc.), the timeframe for pivots, and other display settings.
The first part of your code calculates the high and low levels for different timeframes, which are plotted on the chart as crosses. The second part involves the pivot point calculations, where the user selects the type of pivot point calculation (Traditional, Fibonacci, etc.), the timeframe for pivots, and other display settings.
Açık kaynak kodlu komut dosyası
Gerçek TradingView ruhuyla, bu komut dosyasının mimarı, yatırımcıların işlevselliğini inceleyip doğrulayabilmesi için onu açık kaynaklı hale getirdi. Yazarı tebrik ederiz! Ücretsiz olarak kullanabilseniz de, kodu yeniden yayınlamanın Topluluk Kurallarımıza tabi olduğunu unutmayın.
Feragatname
Bilgiler ve yayınlar, TradingView tarafından sağlanan veya onaylanan finansal, yatırım, alım satım veya diğer türden tavsiye veya öneriler anlamına gelmez ve teşkil etmez. Kullanım Koşulları bölümünde daha fazlasını okuyun.