OPEN-SOURCE SCRIPT
Güncellendi TDPO-RSI (Time-Decaying Percentile RSI)
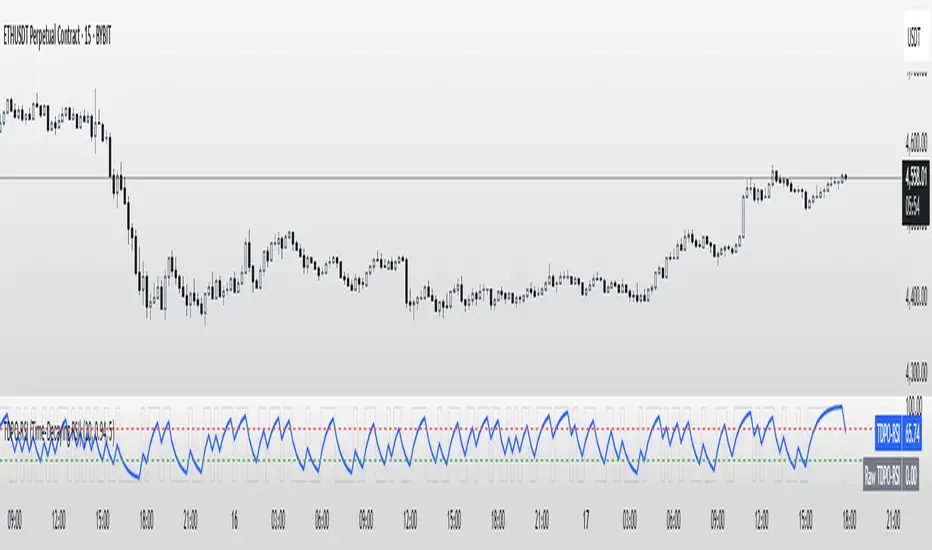
TDPO-RSI (Time-Decaying Percentile RSI)
TDPO-RSI is a modern, statistically-enhanced momentum indicator that improves on traditional RSI by using percentile-based analysis with exponential time decay. Instead of averaging gains and losses equally, this indicator ranks them by size and weights recent data more heavily—resulting in a more responsive and noise-resistant signal.
How it works:
Calculates percentile rank of gains and losses over a lookback window
Applies a decay factor (lambda) to give more weight to recent price action
Outputs a percentile-based RSI value between 0 and 100
Optional smoothing via EMA for clearer crossover signals
Key Uses:
Identify overbought/oversold zones (default: 70/30)
Use raw vs. smoothed RSI crossovers for entries
Detect momentum shifts earlier than traditional RSI
Suitable for scalping, trend continuation, and reversal setups
Inputs:
Lookback Length: Number of bars used for percentile calculation
Decay Factor (lambda): How quickly older data fades in influence (0.80–0.99)
Smoothing EMA: Smooths the final output to reduce noise
Tip: Combine with price structure and volume for best results. Higher timeframes can be used for trend context, while lower timeframes help with precise entries.
This tool is ideal for traders who want adaptive momentum analysis rooted in statistical behavior.
Sürüm Notları
TDPO-RSI (Time-Decaying Percentile RSI)Overview:
The TDPO-RSI applies percentile ranking methodology to RSI calculations with exponential time decay weighting. This approach differs from traditional RSI by ranking price changes by magnitude rather than using simple arithmetic averages, while applying greater weight to recent data points.
Technical Methodology:
Calculates percentile ranks of price gains and losses over a specified lookback period
Applies exponential decay factor (lambda) to weight recent observations more heavily than historical ones
Converts percentile rankings to a 0-100 scale similar to traditional RSI
Optional exponential moving average smoothing to reduce signal volatility
Parameters:
Lookback Length: Number of historical bars used for percentile calculations
Decay Factor (Lambda): Controls the rate of exponential decay for historical data weighting (typically 0.80-0.99)
Smoothing EMA: Period for optional exponential moving average smoothing
Usage Applications:
Momentum analysis using percentile-based ranking instead of arithmetic averaging
Overbought/oversold level identification (commonly 70/30 thresholds)
Signal generation through crossovers between raw and smoothed values
Divergence analysis between price and momentum
Important Limitations:
Percentile calculations require sufficient historical data to be meaningful
Performance varies significantly across different market conditions and timeframes
Should be used in conjunction with other analysis methods rather than as a standalone system
Past performance of any momentum indicator does not guarantee future results
Technical Note:
This indicator modifies traditional RSI methodology by incorporating statistical ranking and time decay weighting. Users should test thoroughly on historical data and understand the mathematical differences before implementation in live trading.
Açık kaynak kodlu komut dosyası
Gerçek TradingView ruhuyla, bu komut dosyasının mimarı, yatırımcıların işlevselliğini inceleyip doğrulayabilmesi için onu açık kaynaklı hale getirdi. Yazarı tebrik ederiz! Ücretsiz olarak kullanabilseniz de, kodu yeniden yayınlamanın Topluluk Kurallarımıza tabi olduğunu unutmayın.
Feragatname
Bilgiler ve yayınlar, TradingView tarafından sağlanan veya onaylanan finansal, yatırım, alım satım veya diğer türden tavsiye veya öneriler anlamına gelmez ve teşkil etmez. Kullanım Koşulları bölümünde daha fazlasını okuyun.