OPEN-SOURCE SCRIPT
Momentum Scope

Overview
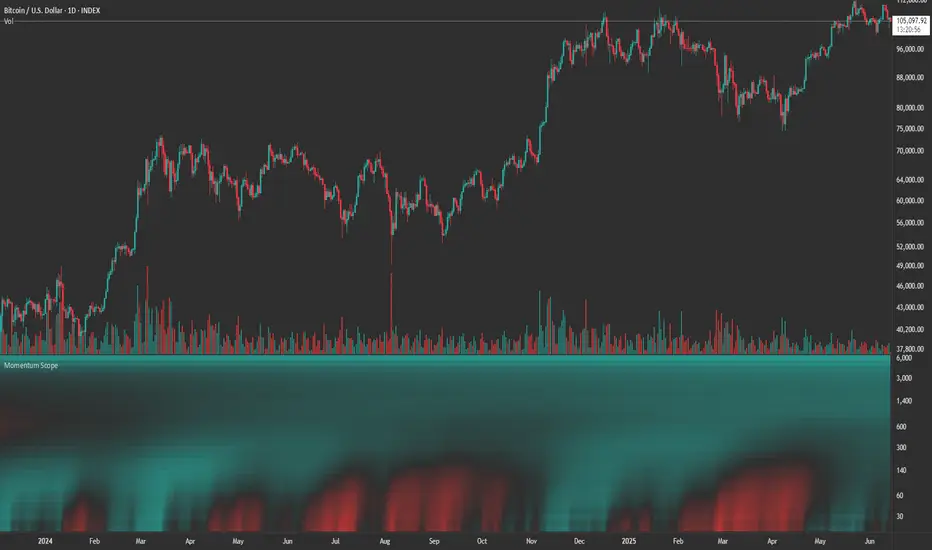
Momentum Scope is a Pine Script™ v6 study that renders a –1 to +1 momentum heatmap across up to 32 lookback periods in its own pane. Using an Augmented Relative Momentum Index (ARMI) and color shading, it highlights where momentum strengthens, weakens, or stays flat over time—across any asset and timeframe.
Key Features
Inputs & Customization
How to Use
Copyright © 2025 MVPMC. Licensed under MIT. For full license see opensource.org/licenses/MIT
Momentum Scope is a Pine Script™ v6 study that renders a –1 to +1 momentum heatmap across up to 32 lookback periods in its own pane. Using an Augmented Relative Momentum Index (ARMI) and color shading, it highlights where momentum strengthens, weakens, or stays flat over time—across any asset and timeframe.
Key Features
- Full-Spectrum Momentum Map: Computes ARMI for 1–32 lookbacks, indexed from –1 (strong bearish) to +1 (strong bullish).
- Flexible Scale Gradation: Choose Linear or Exponential spacing, with adjustable expansion ratio and maximum depth.
- Trending Bias Control: Apply a contrast-style curve transform to emphasize trending vs. mean-reverting behavior.
- Duotone & Tritone Palettes: Select between two vivid color styles, with user-definable hues for bearish, bullish, and neutral momentum.
- Compact, Overlay-Free Display: Renders solely in its own pane—keeping your price chart clean.
Inputs & Customization
- Scale Gradation: Linear or Exponential spacing of intervals
- Scale Expansion: Ratio governing step-size between successive lookbacks
- Scale Maximum: Maximum lookback period (and highest interval)
- Trending Bias: Curve-transform bias to tilt the –1 … +1 grid
- Color Style: Duotone or Tritone rendering modes
- Reducing / Increasing / Neutral Colors: Pick your own hues for bearish, bullish, and flat zones
How to Use
- Add to Chart: Apply “Momentum Scope” as a separate indicator.
- Adjust Scale: For exponential spacing, switch your indicator Y-axis to Logarithmic.
- Set Bias & Colors: Tweak Trending Bias and choose a palette that stands out on your layout.
- Interpret the Heatmap:
- Red tones = weakening/bearish momentum
- Green tones = strengthening/bullish momentum
- Neutral hues = indecision or flat momentum
- Red tones = weakening/bearish momentum
Copyright © 2025 MVPMC. Licensed under MIT. For full license see opensource.org/licenses/MIT
Açık kaynak kodlu komut dosyası
Gerçek TradingView ruhuyla, bu komut dosyasının mimarı, yatırımcıların işlevselliğini inceleyip doğrulayabilmesi için onu açık kaynaklı hale getirdi. Yazarı tebrik ederiz! Ücretsiz olarak kullanabilseniz de, kodu yeniden yayınlamanın Topluluk Kurallarımıza tabi olduğunu unutmayın.
MVPMC
Feragatname
Bilgiler ve yayınlar, TradingView tarafından sağlanan veya onaylanan finansal, yatırım, alım satım veya diğer türden tavsiye veya öneriler anlamına gelmez ve teşkil etmez. Kullanım Koşulları bölümünde daha fazlasını okuyun.