OPEN-SOURCE SCRIPT
Regression Line (OLS) w/Residual Bands - Beasley Savage
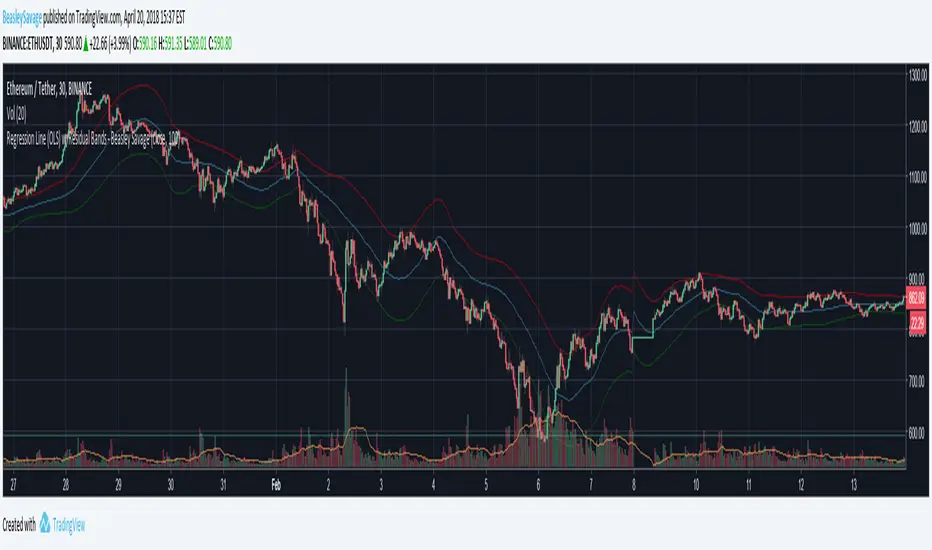
Plots linear regression "line of best fit" for a given source and length. Also plots the standard deviation of residuals as upper and lower bands. For some reason it's not plotting the lines exactly where the values are, so I wouldn't recommend using it as a purely visual indicator, but it could be used in strategies. A quick implementation of a strategy buying when the close crossed over the lower band and selling when close crossed under the upper band resulted in ~60-70% trade accuracy, not taking into account commission/slippage.
If anyone knows how to fix the lines not plotting accurately please let me know :)
If anyone knows how to fix the lines not plotting accurately please let me know :)
Açık kaynak kodlu komut dosyası
Gerçek TradingView ruhuyla, bu komut dosyasının mimarı, yatırımcıların işlevselliğini inceleyip doğrulayabilmesi için onu açık kaynaklı hale getirdi. Yazarı tebrik ederiz! Ücretsiz olarak kullanabilseniz de, kodu yeniden yayınlamanın Topluluk Kurallarımıza tabi olduğunu unutmayın.
Feragatname
Bilgiler ve yayınlar, TradingView tarafından sağlanan veya onaylanan finansal, yatırım, alım satım veya diğer türden tavsiye veya öneriler anlamına gelmez ve teşkil etmez. Kullanım Koşulları bölümünde daha fazlasını okuyun.